Fig. 2.
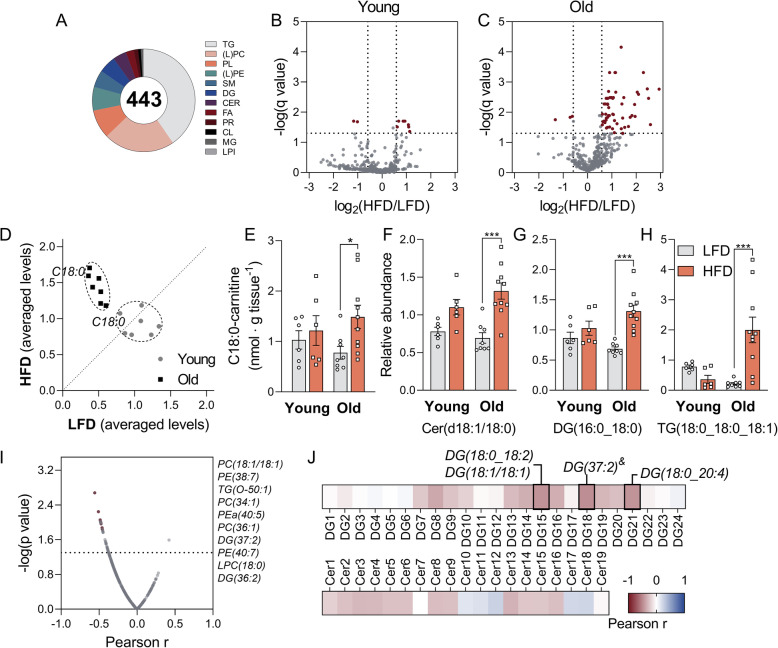
HFD causes extensive lipid remodelling in the quadriceps of aged mice. a Number of detected lipid species per category. TG, triglycerides; (L)PC, (lyso)phosphatidylcholine; PL, plasmalogen; (L)PE, (lyso)phosphatidylethanolamine; SM, sphingomyelin; DG, diacylglycerols; CER, ceramides; FA, fatty acids; PR, prenol lipids; CL, cardiolipin; MG, monoacylglycerols; LPI, lysophosphatidylinositol. Volcano plots comparing the effect of a HFD (vs LFD) on young (b) and old (c) mice, corrected for multiple comparisons with the false discovery rate (FDR) method, with Q = 5%. A fold change threshold was defined as higher than 1.5 or smaller than 0.66. d Scatter plot of normalized levels of long-chain acylcarnitines detected via untargeted lipidomics (C14:0, C16:0, C18:0, C20:0, C16:0-OH, C18:0-OH, C18:1-OH). Each dot represents the mean value of a specific metabolite on the HFD (y-axis) vs the LFD (x-axis). Prior to plotting, the levels of each acylcarnitine were normalized to the average value of the same acylcarnitine in all animals. Metabolites along the dashed line are not regulated by the diet (mean LFD = mean HFD), while metabolites above or below the line are up- or downregulated, respectively, by the HFD. e Concentrations of C18:0-carnitine detected by LC-MS. f–h Comparison between diets and age for Cer(d18:1/18:0), DG(16:0_18:0) and TG(18:0_18:0_18:1), respectively. I Pearson correlation coefficients (r) between detected lipid species and MISI (x-axis) plotted against -log(p-value) (y-axis). The top 10 lipids with the highest correlation coefficients are specified next to the figure. J Heatmap for Pearson correlation coefficients for detected DGs and Cers (from all groups) vs MISI (&low signal lipid, only summed structure information). Statistically significant correlations (p < 0.05) are highlighted. Data are shown as mean ± SEM, n = 6 (young groups) or 10 (old groups). Statistical analysis was conducted for each group according to the “Materials and Methods” section; ###p < 0.001 (old vs young), ##p < 0.01 (old vs young), #p < 0.05 (old vs young), ***p < 0.001 (LFD vs HFD), **p < 0.01 (LFD vs HFD), *p < 0.05 (LFD vs HFD). Supporting data values can be found in Additional file 10 and lipidomics dataset in Additional file 3.

