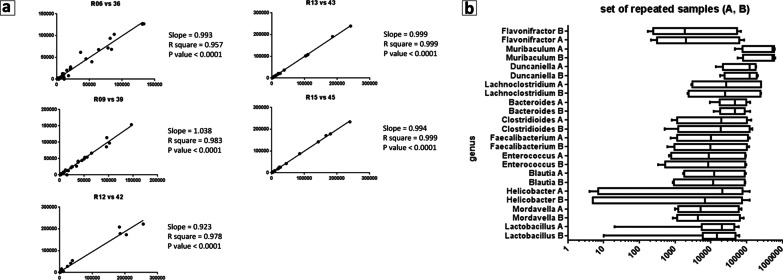
Fig. 1.
Correlation analysis for each pair of 5 re-sequenced samples. a Each dot represents a species, plotted from normalized counts for sample a (X-axis) and for sample b (Y-axis) of each pair. Slope, Pearson correlation coefficient (r), and p-value are shown for each pair of samples. The values of those indexes indicate that each re-sequenced pair of samples shows significant correlation. b Top 12 genera in the mouse gut microbiota of five samples sequenced at time A and of the same samples sequenced at time B. Genera (listed in Y-axis) are depicted with boxes including 5–95% of data, median values (dark lines in the boxes). Plots are based on normalized counts (X-axis). Outcome of the analysis in the two set of samples is almost identical

