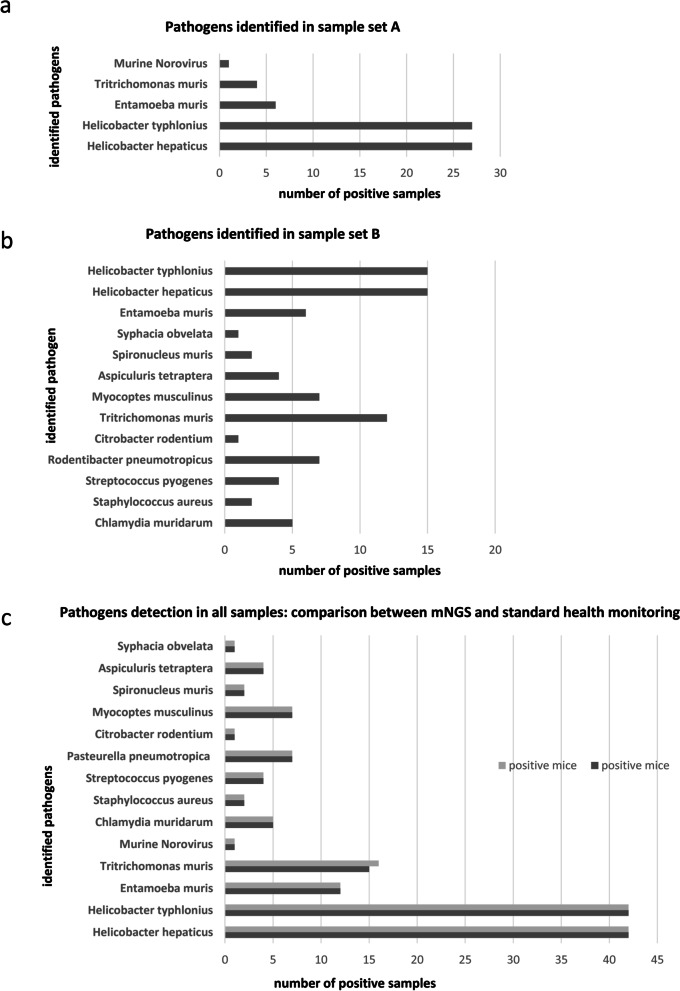
Fig. 6.
Summary of detected pathogens. Number of positive samples for different pathogen species detected by mNGS in a 27 non SPF fecal samples (sample set A) and in b additional 15 non SPF fecal samples (sample set B). c Comparison between metagenomic data (dark gray bars) and results from health monitoring assays (light gray bars) employed for pathogens detection in all 42 non-SPF mice. x axis: number of samples positive for the indicated pathogen. y axis: pathogen species. All data were confirmed by PCR and sequencing

