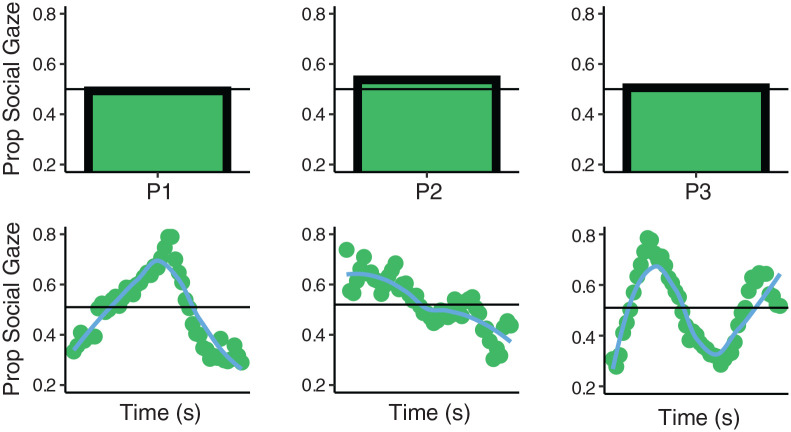
Figure 1.
Shows gaze proportion data for 3 participants from the present study who viewed competing displays of social and nonsocial images for 5 s. The upper row shows the average gaze proportion data. Horizontal line demarcates 50% of trial time spent looking at social image. The lower row shows average time-series data for the same 3 observers. Points indicate gaze proportion within 100 ms time bins from the start to end of trial. Line indicates local weighted regression fit to the data.

