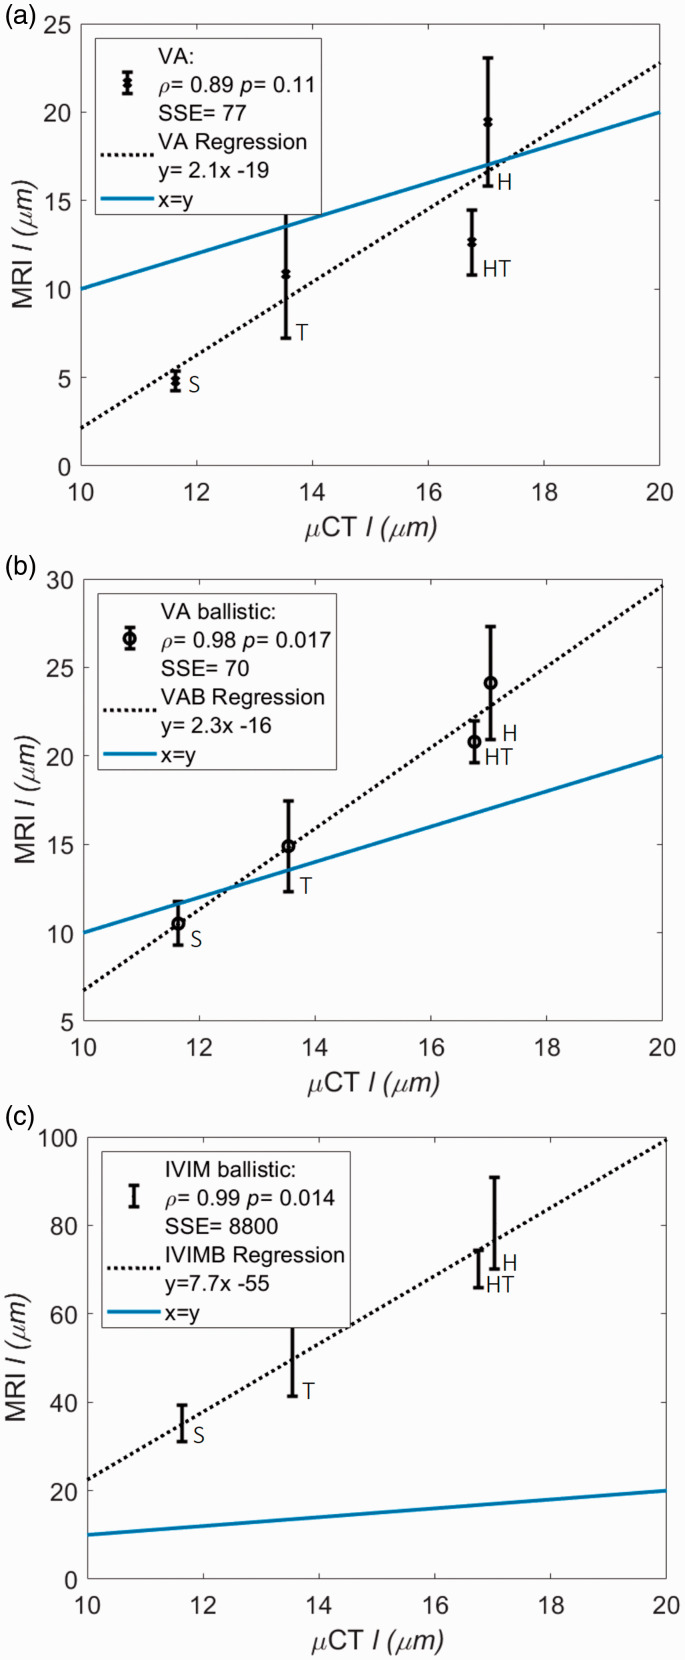
Figure 4.
Regional average WKY MRI estimates of (± standard error of the mean) versus the median of CT estimates. Estimates are shown from three methods of velocity () estimation which then uses to estimate : the VA model (a), the VA ballistic (VAB) model (b) and the IVIM ballistic (IVIMB) model (c). The line of identity is displayed (blue), as is the regression line for each method (dashed black). Estimates for the striatum (S), thalamus (T), hypothalamus (HT) and hippocampus (H) are shown.

