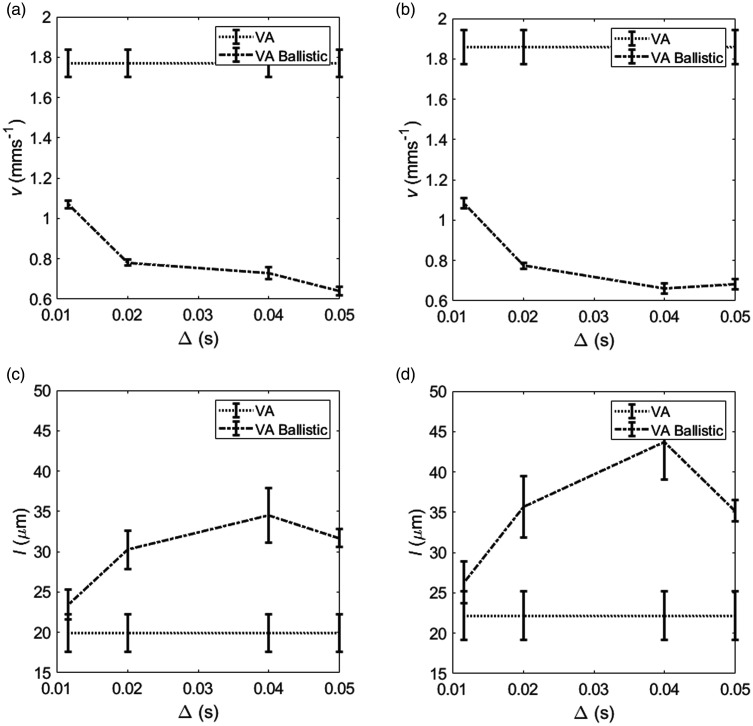
Figure 6.
(a) and (c) show F344 rat and region average (± standard error of the mean) for estimates of the velocity, , and capillary segment length,, for the velocity autocorrelation model (VA) and the VA ballistic model. is calculated using the pseudo-diffusion coefficient () estimated using =50 ms. (b) and (d) show the same for the WKY rat strain. The points are joined to show the relative values for each model more clearly. The values for the VA model are flat since all diffusion-times are used in parameter estimation.

