Figure 5.
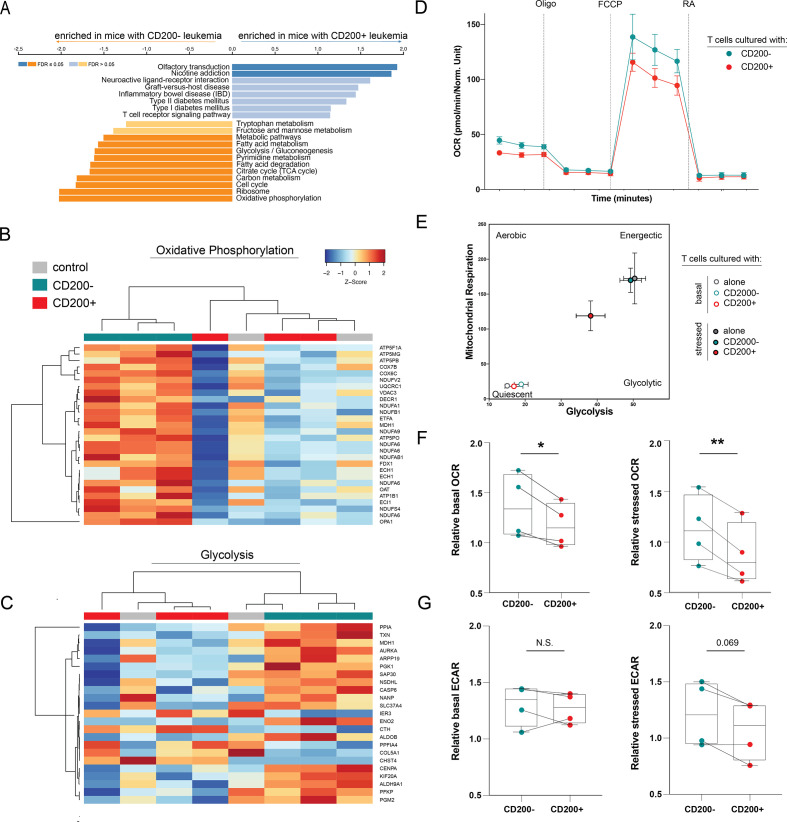
CD200+ leukemia directly suppresses T cell metabolism. (A) GSEA analysis of genes enriched in T cells from mice CD200+ leukemia compared with T cells from mice with CD200− leukemia. (B–C) Heatmap of differentially expressed genes in the oxidative phosphorylation (B) and glycolysis (C) pathways between human T cells from mice with CD200+ or CD200− OCI-AML3 leukemia or humanized-only controls. Only regulated genes with p<0.05 are displayed. The color scale corresponds to the row-wise Z score of gene expression. (D) Representative OCR measured at baseline and in response to oligomycin (Oligo), carbonyl cyanide p-trifluoromethoxy-phenylhydrazone (FCCP), and rotenone+antimycin A (RA) in human CD3+ T cells after co-culture with CD200+ or CD200− OCI-AML3 leukemia. (E) Representative XF cell energy phenotype of human CD3+ T cells alone or after co-culture with CD200+ or CD200− OCI-AML3 leukemia. (F–G) Summary basal and stressed OCR (F) and ECAR (G) for 4 healthy T cell donors. To account for donor variability, OCR and ECAR are reported relative to donor T cells without co-culture. Paired two-sample t-tests were used. *p<0.05, **p<0.01.

