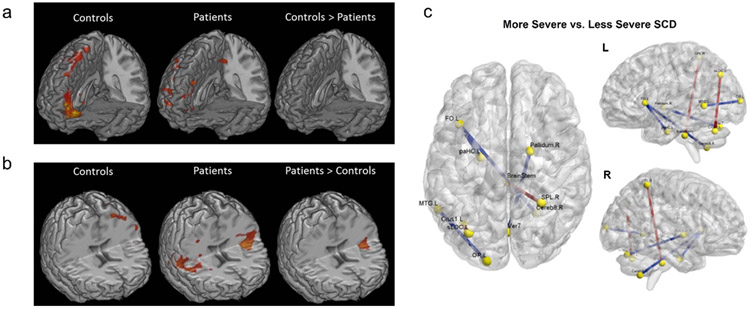
Figure 6.
The brain network change observed in sickle cell disease (SCD) patients. a)-b) EEG-fMRI spontaneous power comparison regarding alpha power band (i.e. 8-12 Hz) in a) and beta1 power band (i.e. 13-21 Hz) in b). Significant different brain connectivity at specific locations, e.g. insula, can be observed from the SCD patient against healthy controls[27]. c) A comparison between levels of SCD severity in regard of the functional connectivity strength with significant differences illustrated in colored edges[194].

