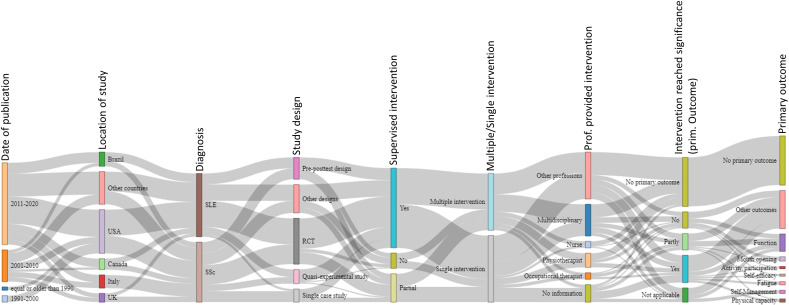
Figure 3.
Sankey diagram. This diagram illustrates relationships between different studies and study characteristics graphically. The bars show the study characteristics that were compared between the studies. The grey lines between the bars are reflecting the congruencies and differences between the different studies. The wider the grey connection lines are, the more congruency exists. RCT, randomised controlled trial; SLE, systemic lupus erythematosus; SSc, systemic sclerosis.

