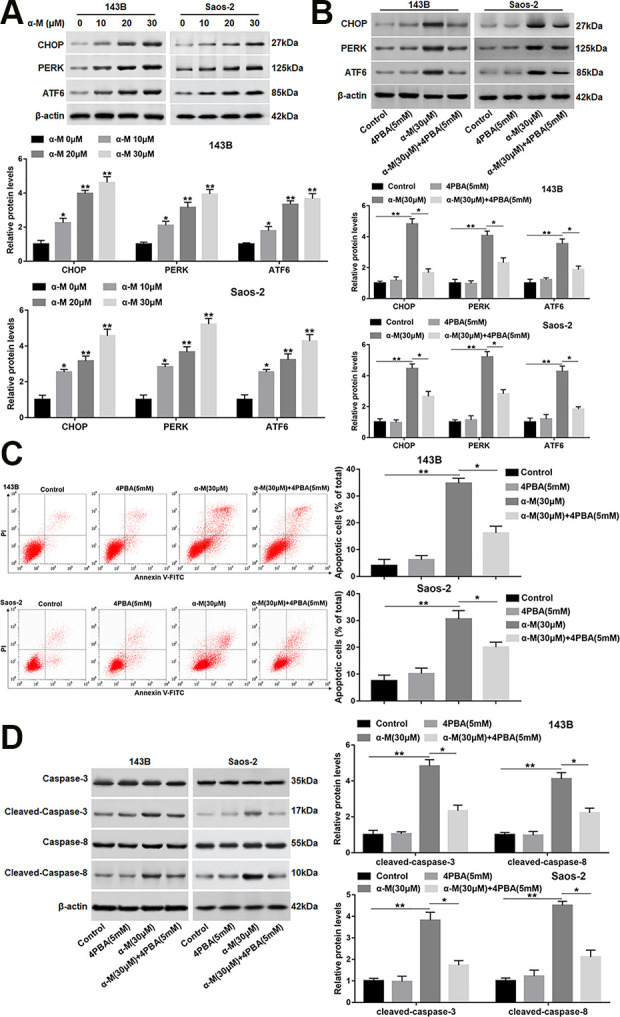
Figure 3.

α-mangostin induces ER stress in 143B and Saos-2 cells. (A) 143B and Saos-2 cells were treated by different concentrations of α-mangostin (0, 10, 20, 30 μM) for 24 h, and the protein levels of CHOP, PERK, and ATF6 were detected. 4PBA (5 mM) was applied to the cells treated or untreated by α-mangostin (30 μM), and (B) the protein levels of CHOP, PERK and ATF6 were analyzed. (C) Cell apoptosis was determined with Annexin V/PI staining by flow cytometry analysis. (D) The protein expression of cleaved-caspase-3/8 was measured. N=5, *P < 0.05, **P < 0.01.
