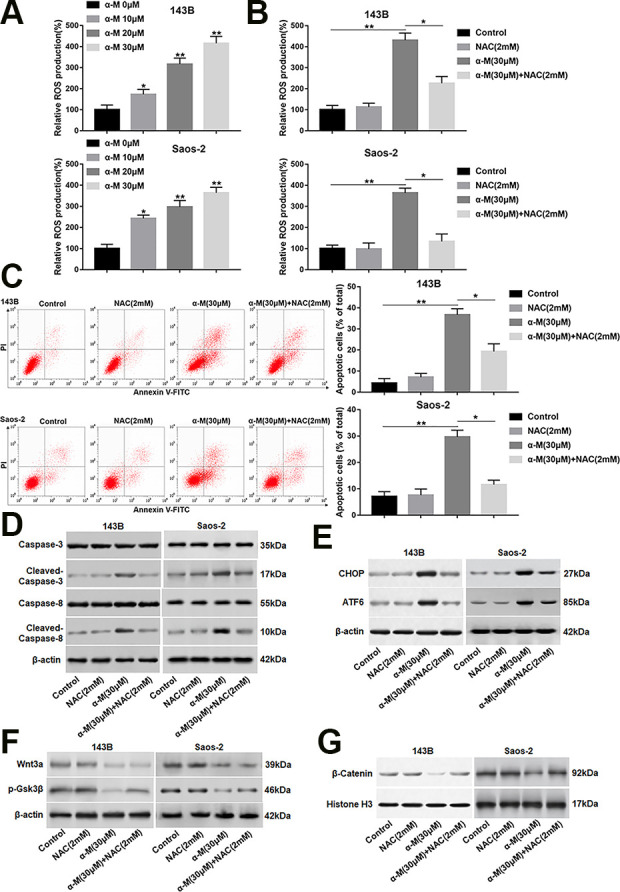
Figure 6.

α-Mangostin increases intracellular ROS level in 143B and Saos-2 cells. (A) 143B and Saos-2 cells were treated with different concentrations of α-mangostin (0, 10, 20 and 30 μM) for 24 h, and the ROS production was detected by DCF-DA staining. 143B and Saos-2 cells were pre-treated by NAC (2 mM) for 2 h, then co-treated with α-mangostin (30 μM) for 24 h. (B) The ROS production was measured by DCF-DA staining. (C) Cell apoptosis was analyzed with flow cytometry. (D, E) The protein levels of cleaved-caspase-3/8, CHOP and ATF6 were determined. (F, G) The expression of Wnt3a, p-Gsk3β and nuclear β-catenin was analyzed. N = 5, *P < 0.05, **P < 0.01.
