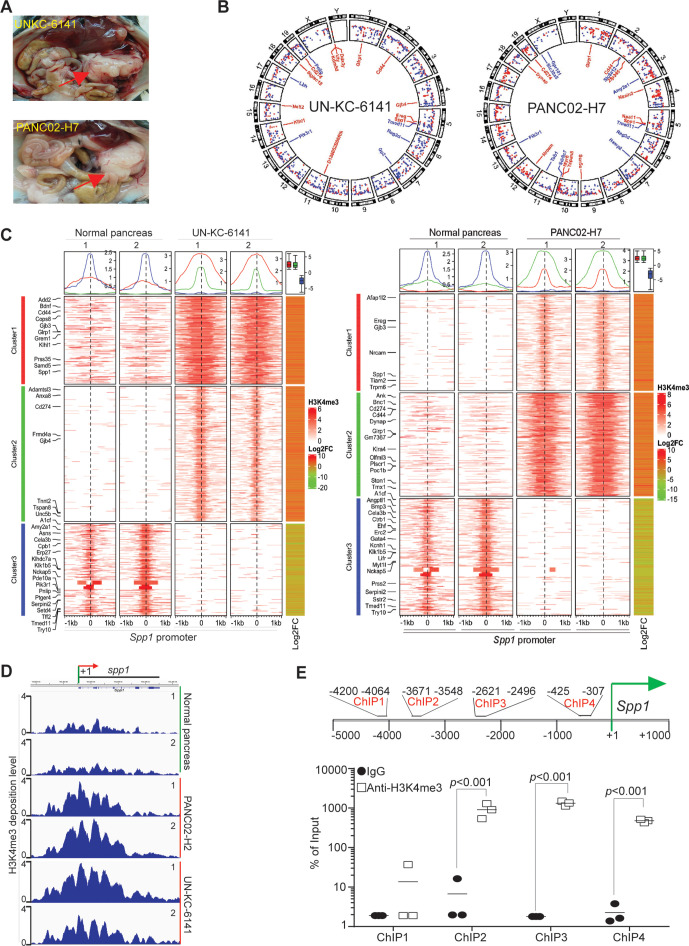
Figure 1.
The promoter of Spp1 and Cd44 are enriched with H3K4me3 deposition in mouse pancreatic carcinoma in vivo. (A) Orthotopic pancreatic UN-KC-6141 and PANC02-H7 tumor mouse models. the red arrows indicate the tumors. (B) Normal pancreas and the orthotopic pancreatic tumors as shown in A were collected for chromatin preparation and immunoprecipitation using H3K4me3-specific antibody. The CHIP DNA libraries were sequenced by illumina NGS sequencing and analyzed using bioinformatics pipeline described in the methods. Shown is the circos plot of the genome-wide distribution of differential H3K4me3 peaks between normal and tumor samples along all chromosomes. The differential peaks with log2 fold change >1 are shown and peaks associated several genes with known functions in immune suppression and tumor progression are mapped in the inner circle. (C) The left two heatmaps illustrate differential H3K4me3 signals within the 2 kb window from the center of each peak. The H3K4me3 ChIP-Seq data from two biological replicates were merged and used to plot the heatmap. The line graphs on top of the heatmap demonstrate the average accessibility profiles of three clusters with increased or decreased H3K4me3 signals. The column on the right which shows matched average expression log2FC of 2 replicates, and the results are summarized in the box plot shown on top of the column. Representative genes with significant changes in both H3K4me3 and gene expression are listed beside the heatmap. (D) H3K4me3 deposition profile in the Spp1 gene region. (E) Spp1 promoter structure showing CHIP PCR-amplified regions (top panel). UN-KC-6141 tumors were analyzed by H3K4me3 CHIP and qPCR (bottom panel) using the PCR primer pairs as indicated in the top panel ChIP-Seq, chromatin immunoprecipitation sequencing.

