Figure 6.
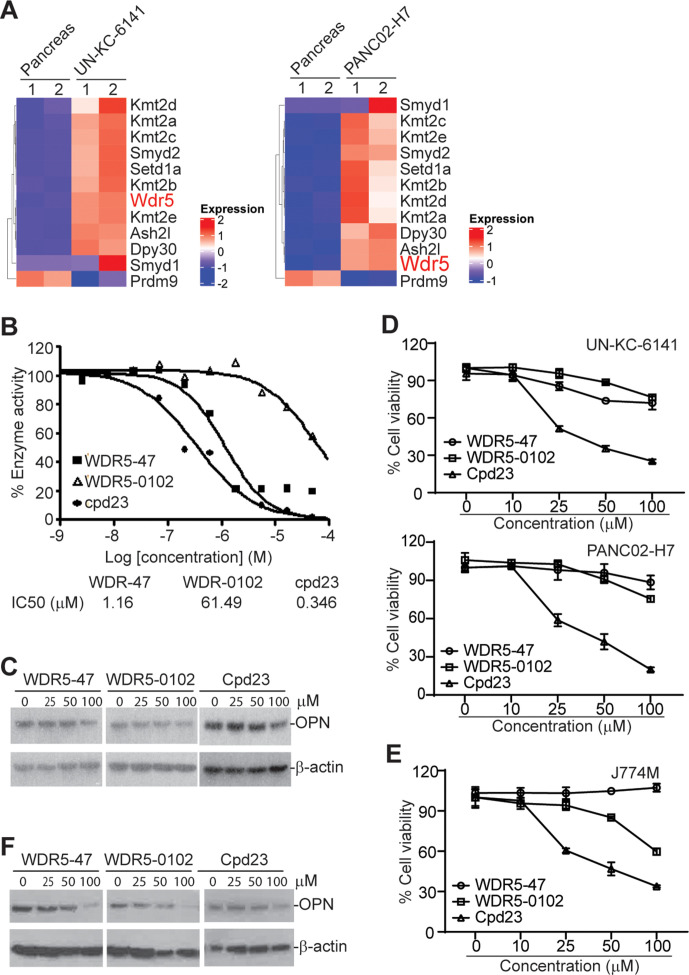
The WDR5-H3K4me3 axis regulates OPN expression in tumor cells and MDSCs. (A) Heatmap of differentially expressed histone methyltransferases. Shown are ratios of tumor versus normal pancreas with red indicates upregulation in tumor cells and blue indicates downregulation in tumor cells. (B) WDR5 inhibitors were tested in a 10-dose IC50 mode with threefold serial dilutions using [3H]S-adenosyl-methionine as substrate with recombinant human MLL1-WDR5 complex. The enzyme activity was plotted against inhibitor concentrations. IC50s were calculated using the GraphPad prism program. (C) UN-KC-6141 cells were cultured in the presence of WDR5 inhibitors at the indicated concentrations for 24 hours and analyzed by Western blotting. (D) Tumor cells were cultured in the presence of WDR5 inhibitors at the indicated concentrations for 24 hours and analyzed for cell viability. (E) J774M cells were cultured in the presence of WDR5 inhibitors at the indicated concentrations for 24 hours and analyzed for cell viability. (F) J774M cells were cultured in the presence of WDR5 inhibitors at the indicated concentrations for 24 hours and analyzed by Western Blotting. MDSCs, myeloid-derived suppressor cells; OPN, osteopontin.

