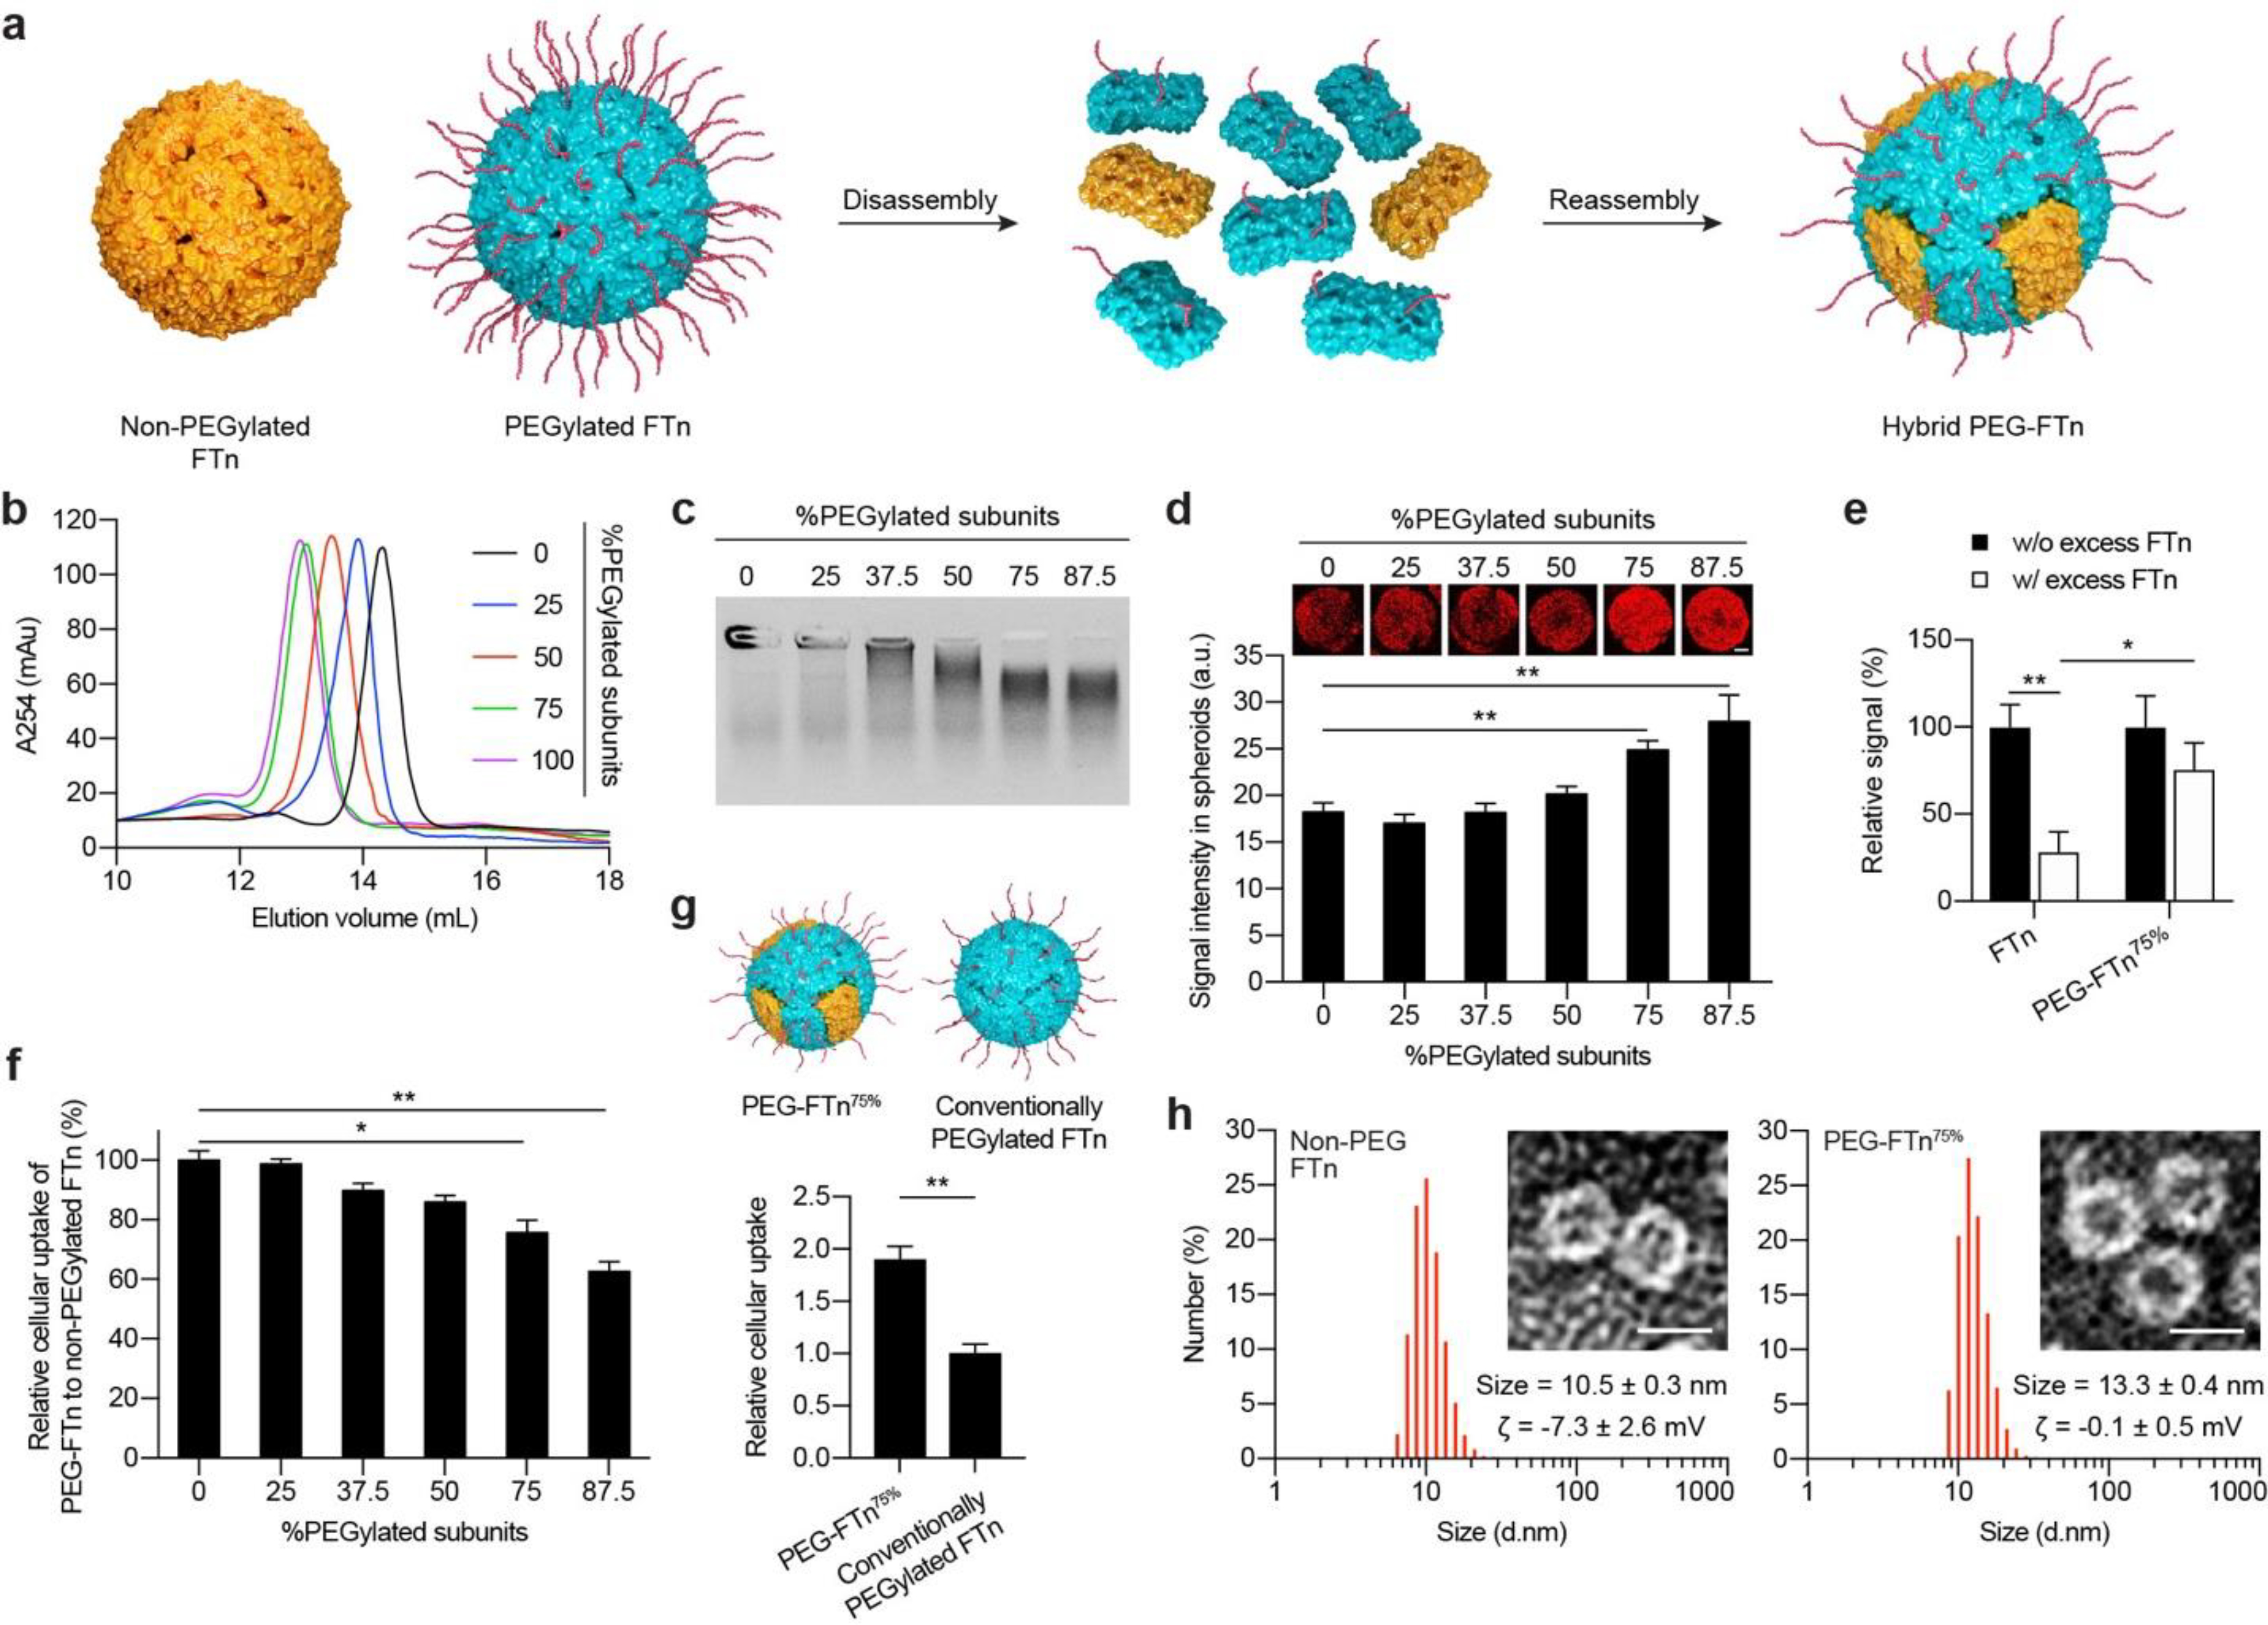
Figure 1. In vitro characterization of hybrid PEG-FTn: identification of an optimal hybrid PEG-FTn formulation.

(a) Schematic illustration of hybrid PEG-FTn preparation via a sequential disassembly and reassembly procedure. (b) Size exclusion chromatography of hybrid PEG-FTn engineered with varying factions of PEGylated ferritin subunits. (c) Colloidal stability of hybrid PEG-FTn candidates in 10% human plasma. (d) Penetration of hybrid PEG-FTn candidates through 3LL multicellular spheroids. Representative 3D-reconstructed images of the spheroids treated with Cy5-labeled PEG-FTn are shown above the graph. Scale bar = 100 pm. (e) Relative penetration of FTn or PEG-FTn75% through 3LL-based spheroids in the absence or presence of an excess of unlabeled FTn. (f) Cellular uptake of hybrid PEG-FTn candidates by 3LL cells. The FTn and hybrid PEG-FTn tested in (d-g) include three Cy5-labeled ferritin subunits out of 24 subunits (12.5%) for their fluorometric and microscopic detection. (g) Comparative cellular uptake of PEG-FTn75% and conventionally PEGylated FTn by 3LL cells. (Upper) Schematic illustration of PEG-FTn75% and conventionally PEGylated FTn. Both formulations possess comparable amounts of overall surface PEG content while the spatial distributions are different. (Lower) Fluorometric analysis of cellular uptake. (h) Hydrodynamic diameters and morphology of (Left) non-PEGylated FTn and (Right) PEG-FTn75% determined by dynamic light scattering and TEM, respectively. Scale bar = 10 nm. The average hydrodynamic diameters and the ζ-potentials (ζ) of each formulation are presented. *P < 0.05, **P < 0.01.
