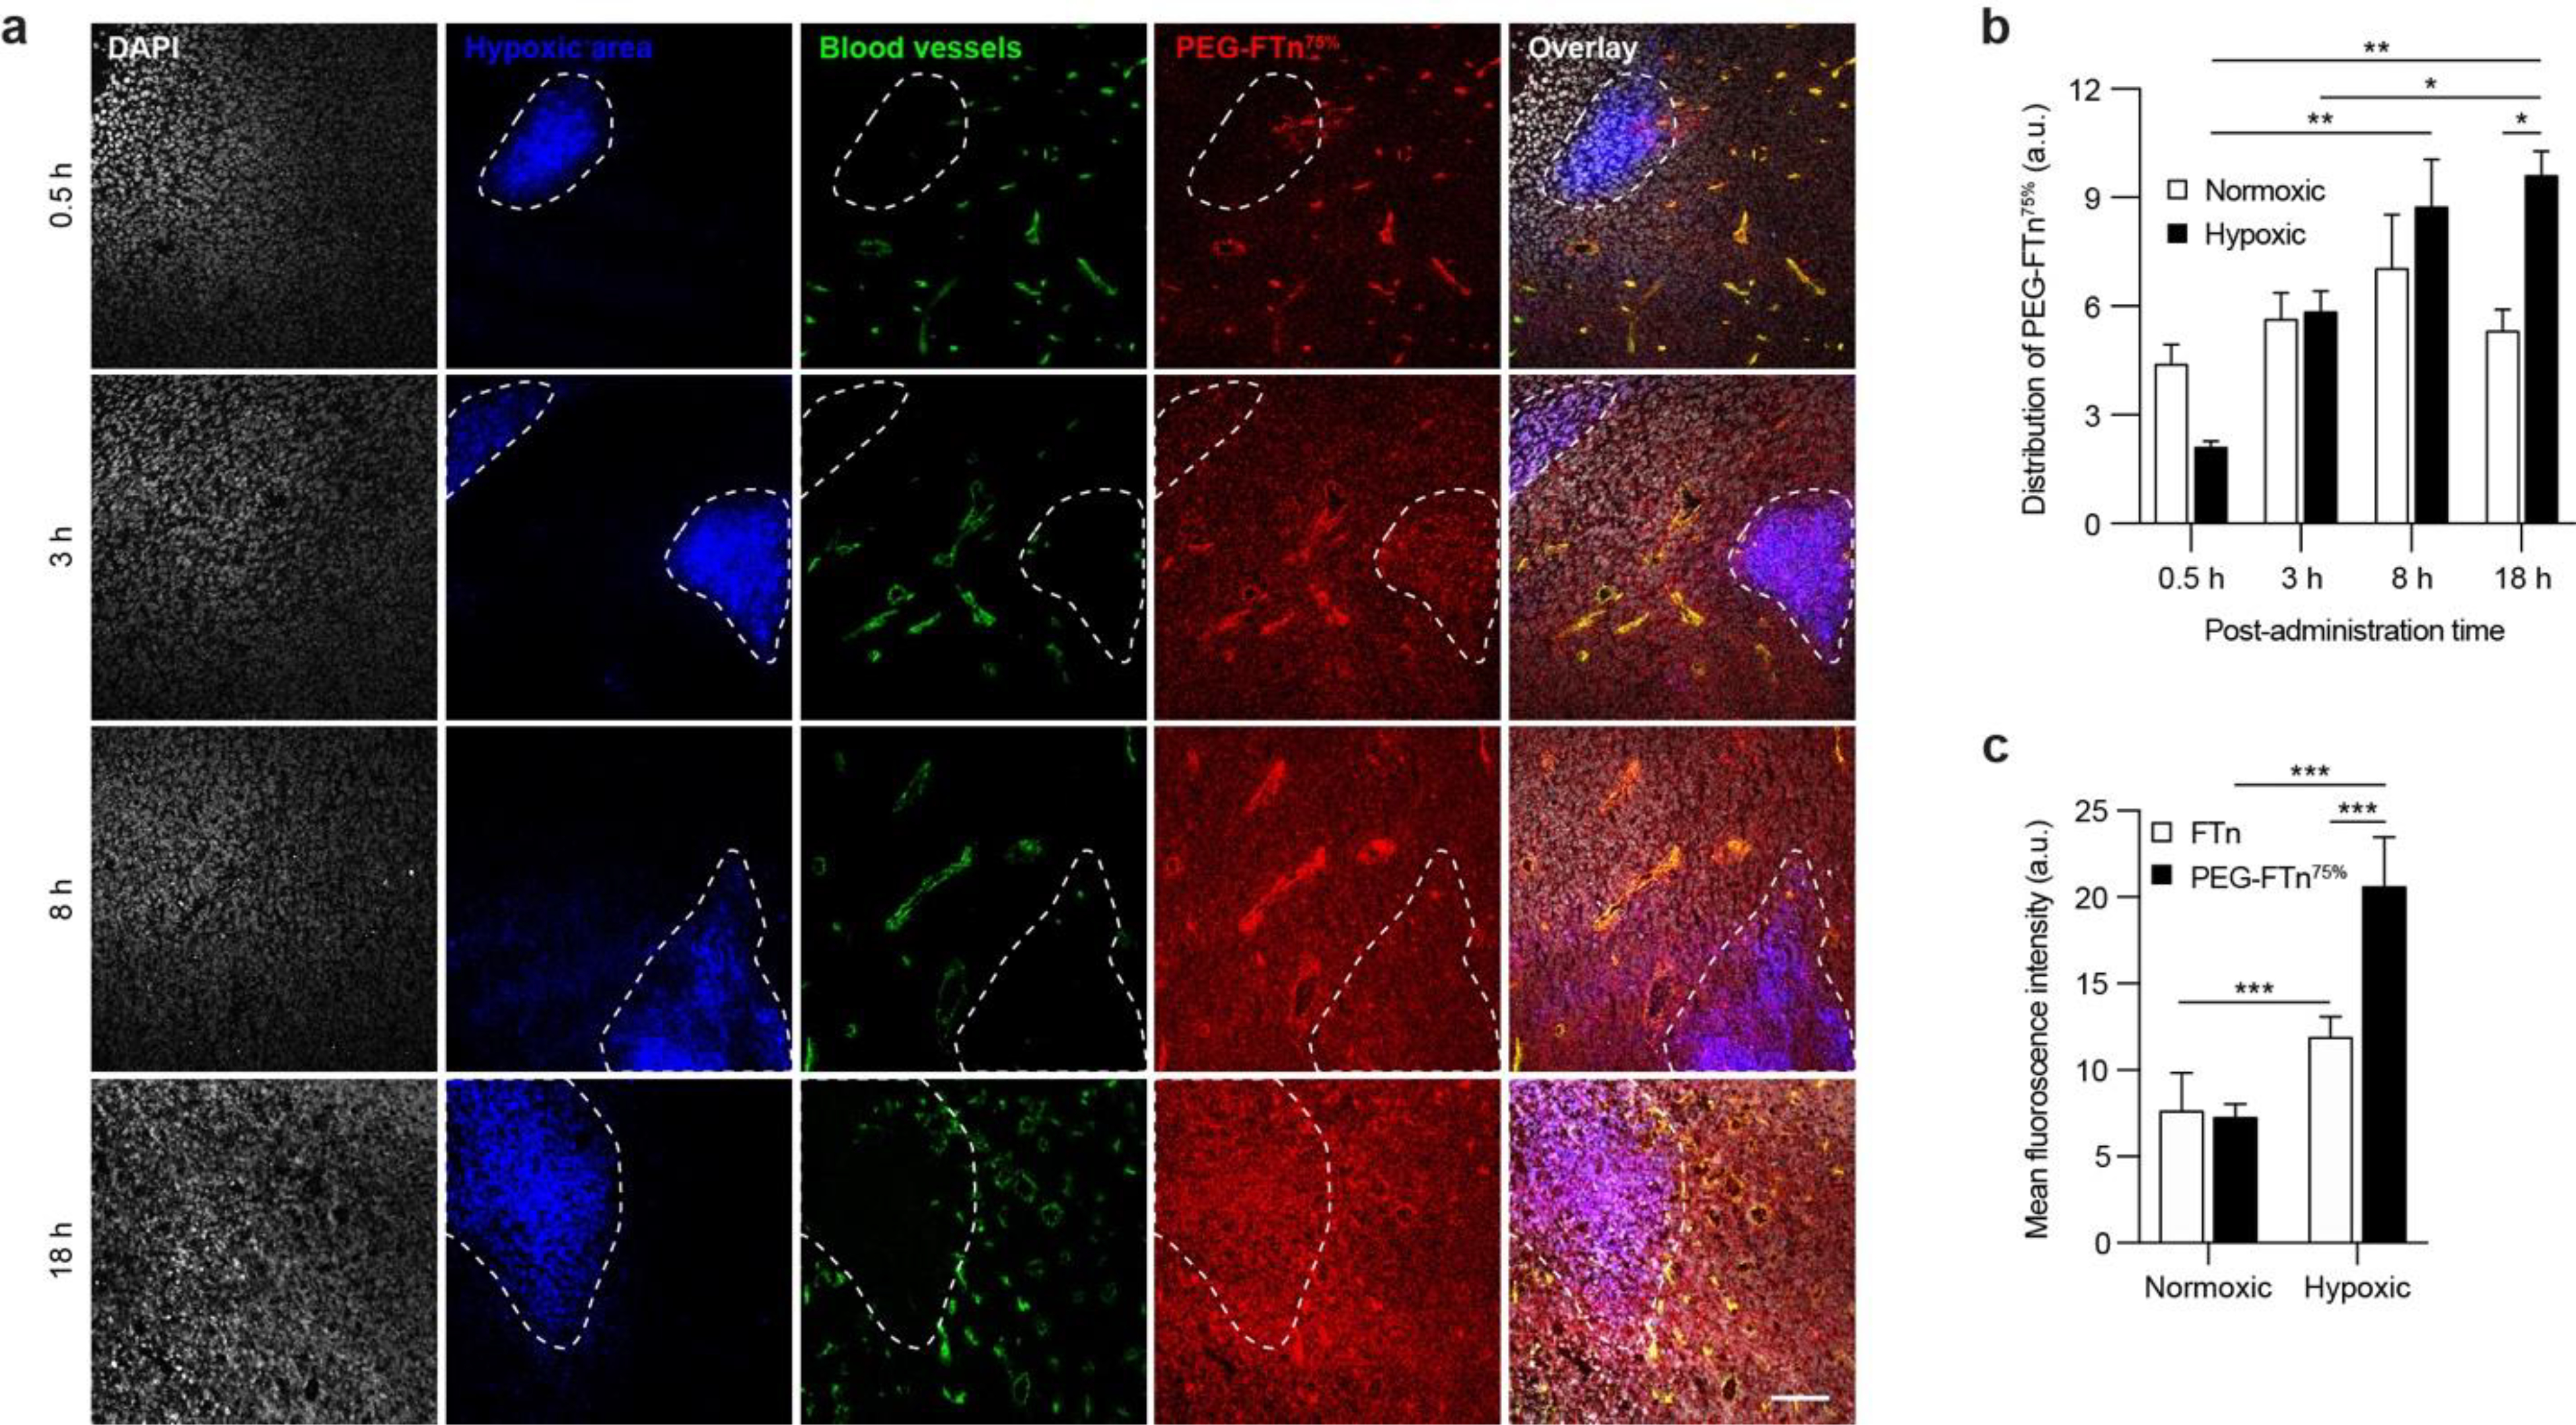
Figure 4. Accumulation of systemically administered PEG-FTn75% in hypoxic areas within 3LL-based flank tumors over time.

(a) Representative confocal images showing time-course accumulation of systemically administered PEG-FTn75% (red) in hypoxic tumor areas (blue). White and green colors represent cell nuclei and blood vessels, respectively. Scale bar = 100 pm. (b) Image-based quantification of PEG-FTn75% localization in normoxic and hypoxic tumor areas at different time points after the administration (n = 4). (c) Flow cytometry analysis of accumulation of PEG-FTn75%, in comparison to non-PEGylated FTn, in normoxic and hypoxic tumor areas 18 h after the administration.
