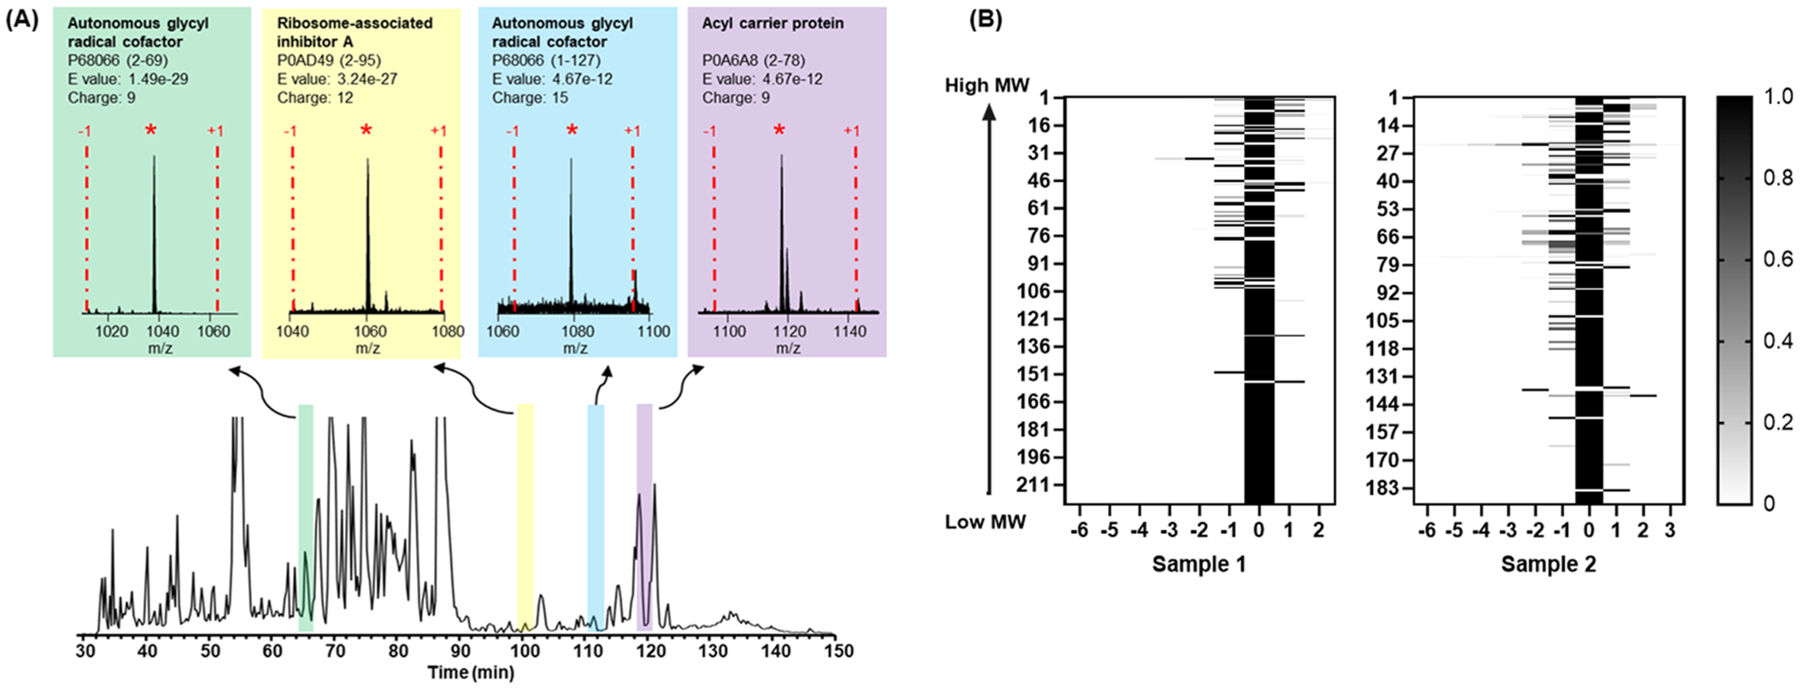
Figure 2.

Intact protein labeling and identification. (A) Examples of labeled proteoforms identified in one LC-MS run. The completely labeled forms are indicated by an asterisk and the −1 and +1 represent proteoforms that are underlabeled or overlabeled by one tag. (B) The identification heatmap of samples 1 and 2. The labeling status is indicated for each intact proteoform after labeling.
