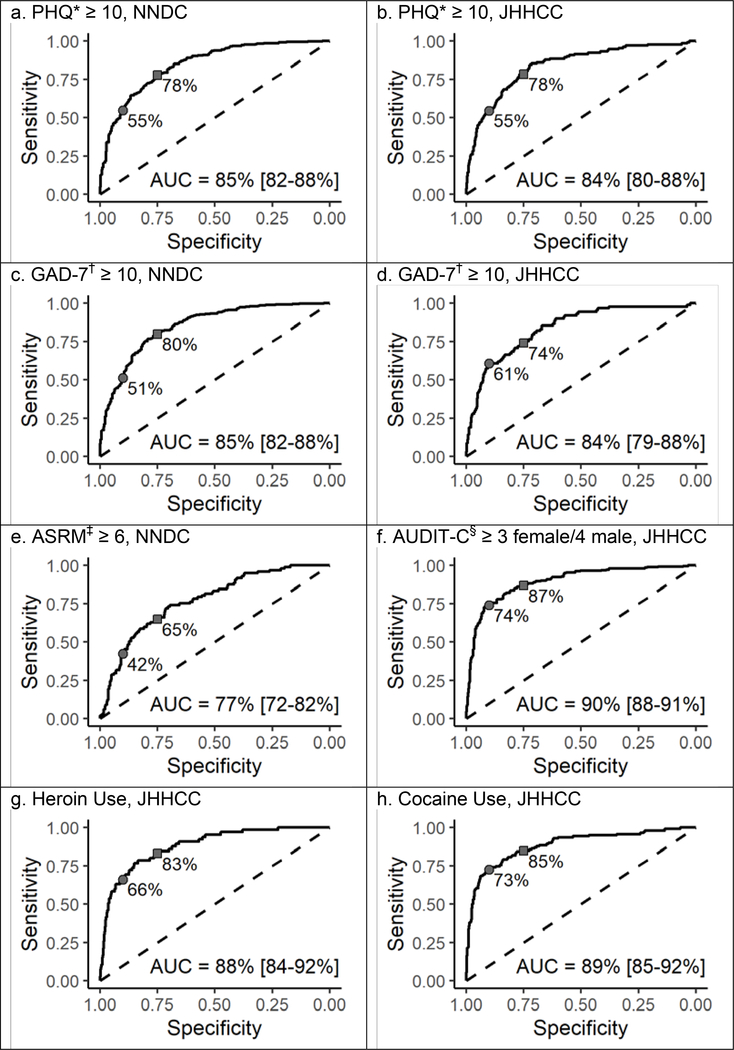
Figure 2: ROC Curves for Dichotomized and Binary Outcomes.
*PHQ = Patient Health Questionnaire (9-item scale for NNDC ranges from 0–27, 8-item scale for JHHCC ranges from 0–24). †GAD-7 = Generalized Anxiety Disorder scale (ranges from 0–21). ‡ASRM = Altman Self-Rating Mania Scale (ranges from 0–20). §AUDIT-C = Alcohol Use Disorders Identification Test consumption questions (ranges 0–12). The sensitivity corresponding to a specificity of 75% (squares) and 90% (circles) are noted on each curve.

