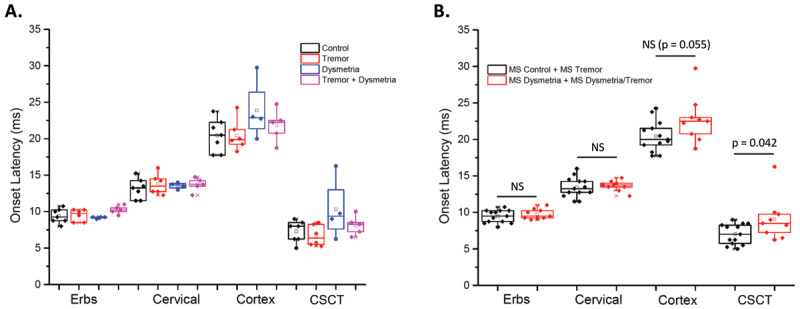
Figure 1.

A. Onset latency of the sensory evoked potentials recorded at Erbs point, cervical spinal cord and cortex and the central sensory conduction times (CSCT) for each MS subgroup. The boxes show the 75th and 25th percentiles and median, the open box shows the mean value and data points with an X show the maximum and minimum values. B. Same data as in A, but the groups have been combined into those with dysmetria (red) and without dysmetria (black). NS = no significant difference between groups.
