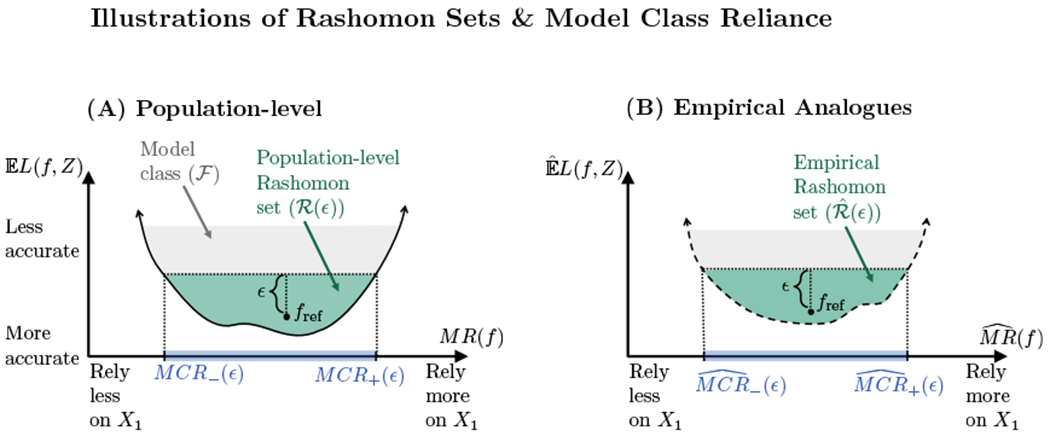
Figure 1:

Rashomon sets and model class reliance – Panel (A) illustrates a hypothetical Rashomon set , within a model class . The y-axis shows the expected loss of each model , and the x-axis shows how much each model f relies on X1 (defined formally in Section 3). Along the x-axis, the population-level MCR range is highlighted in blue, showing the values of MR corresponding to well-performing models (see Section 4). Panel (B) shows the in-sample analogue of Panel (A). Here, the y-axis denotes the in-sample loss, ; the x-axis shows the empirical model reliance of each model on X1 (see Section 3); and the highlighted portion of the x-axis shows empirical MCR (see Section 4).
