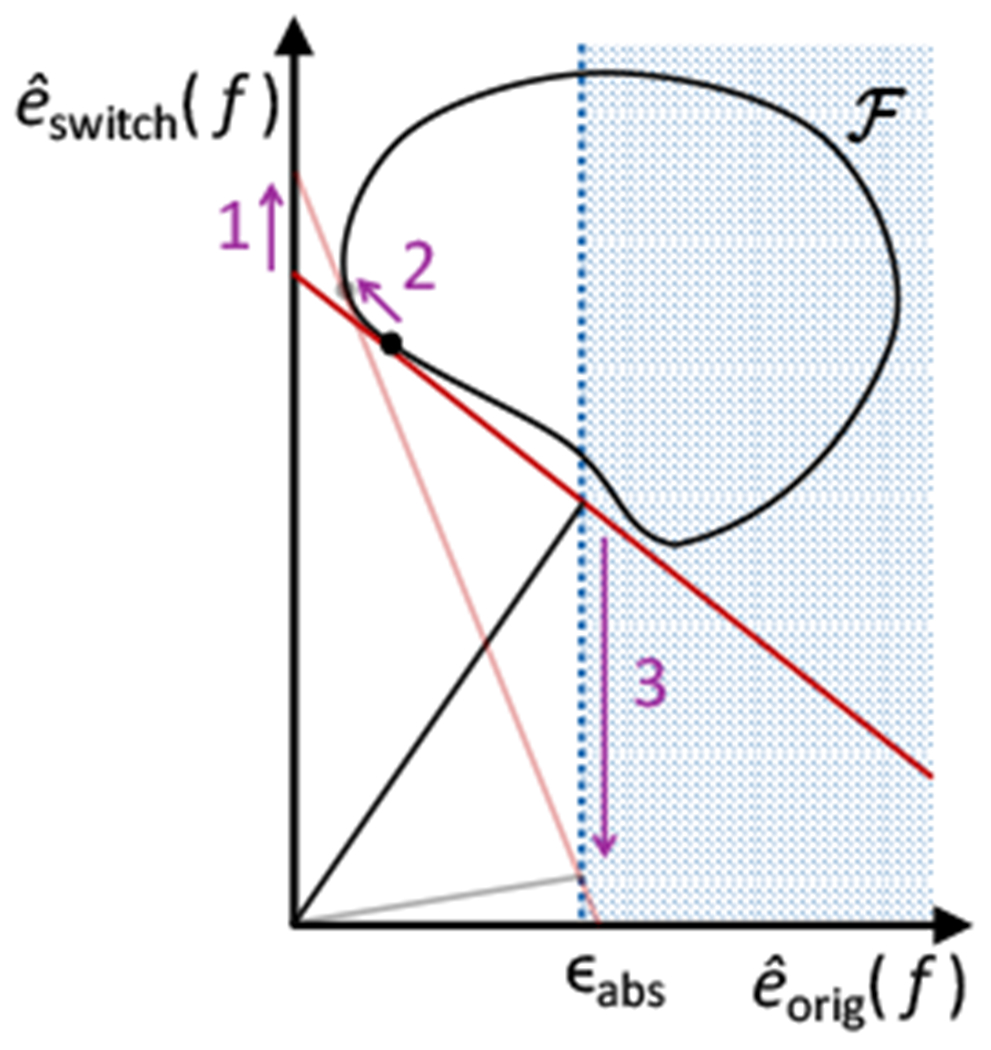
Figure 5:

Monotonicity for binary search. Above we show a version of Figure 4–C for two alternative values of γ. This figure is meant, to add intuition for the monotonicity results in Lemma 10, in addition to the formal proof. Increasing γ is equivalent to decreasing the slope of the red line in Figure 4–C. We define two values γ1 < γ2, where γ1 corresponds to the solid red line, above, and γ2 corresponds to the semi-transparent, red line. The y-intercept values of these lines are equal to and respectively (see Figure 4–C caption). The solid and semi-transparent, black dots mark and respectively. Plugging γ1 and γ2 into Eq 6.1 yields two lower bounds for , marked by the slopes of the solid and semi-transparent, black lines respectively (see Figure 4–C caption). We see that (1) , that (2) , and that (3) the left-hand side of Eq 6.1 is decreasing in γ when . These three conclusions are marked by arrows in the above figure, with numbering matching the enumerated list in Lemma 10.
