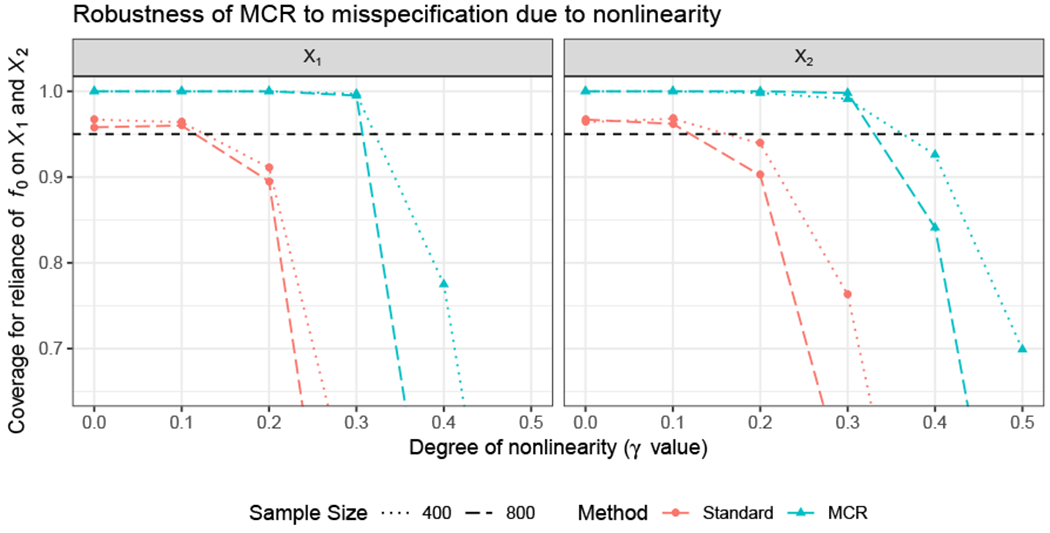
Figure 7:

MR Coverage - The y-axis shows coverage rate for the reliance of f0 on either X1 (left column) or X2 (right column), where X2 is simulated to be more influential that X1. The x-axis shows increasing levels of misspecification (γ). All methods aim to have at least 95% coverage for each scenario (dashed horizontal line).
