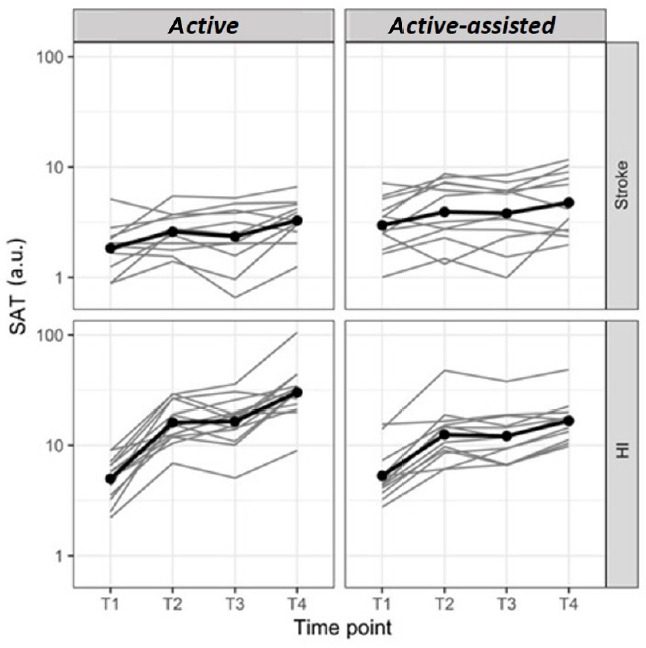
Figure 3.

Evolution of SAT in free speed TESTs on D1 and D2.
The bimanual SAT was expressed in arbitrary units (a.u.) and displayed on a logarithmic scale at four time points: on day 1 before (T1, baseline) and after training (T2), on day 2 before (T3) and after training (T4), in stroke subjects and healthy individuals (HI) in both the active and active-assisted subgroups. Thin grey lines: individuals, thick black lines: mean of the groups. Both the HI and chronic stroke subjects improved on LIFT-THE-TRAY on D1, retained overall the improvements overnight, and kept improving on D2, showing learning of the bimanual cooperative task. SAT: Speed/Accuracy trade-off.
