
Figure 4.
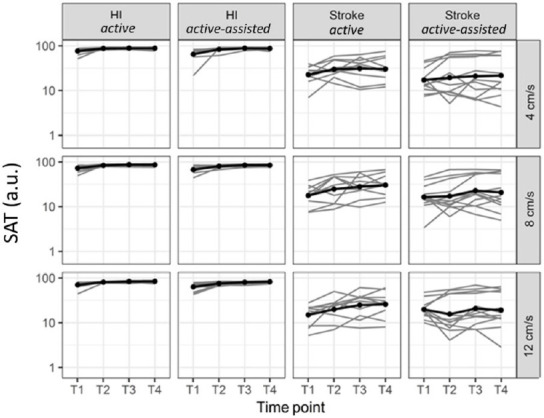
Generalization: SAT evolution from T1 to T4 (imposed speeds: 4, 8, and 12 cm/s).
The bimanual SAT was expressed in arbitrary units (a.u.) and displayed on a logarithmic scale at four time points: on day 1 before (T1, baseline) and after training (T2), on day 2 before (T3) and after training (T4), in stroke subjects and healthy individuals (HI) in both the active and active-assisted subgroups. Thin lines: individuals, thick lines: mean of the groups. In healthy individuals (HI), for both active and active-assisted subgroups, generalization was found at all three imposed speeds and time points. SAT: Speed/Accuracy trade-off.