
Figure 5.
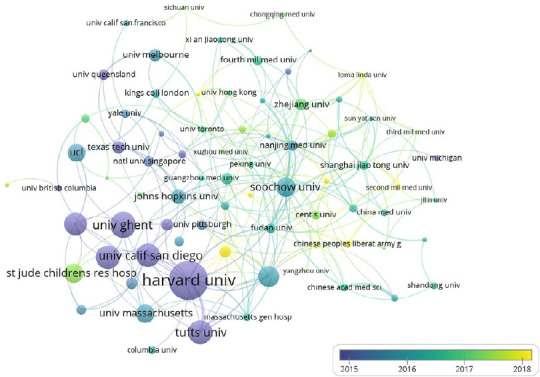
Organizations with co-occurrence relations shown as an overlay graph plotted with VOSviewer 1.6.14.
The analysis method was Linlog/modularity. The weight was citations. Scores are the average published year. The thickness of lines indicates the strength of the relationship. The color indicates the average published year.