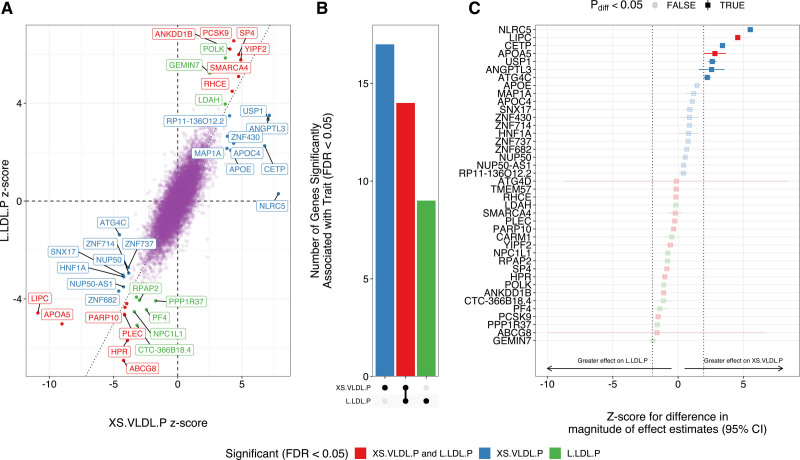
Figure 2.
Genes associated with circulating levels of extra-small very-low-density lipoprotein particle concentration (XS.VLDL.P) and large low-density lipoprotein particle concentration (L.LDL.P) lipoprotein subfractions. Transcriptome-wide association studies were performed integrating liver gene expression data from Genotype-Tissue Expression version 8 with genome-wide association study (GWAS) summary statistics for XS.VLDL.P and L.LDL.P to identify genes associated with circulating levels of each lipoprotein subfraction. A, Genes significantly (false discovery rate [FDR] <0.05) associated with either subfraction are labeled, and colors represent the subfraction associations. B, Bar plot depicts the number of unique and shared genes between the 2 subfractions. C, Forest plot depicts the z score for the difference in the effect magnitude for each gene on each subfraction (|βXS.VLDL.P|−|βL.LDL.P|). Dotted lines represent z scores of ±1.96, with point estimates outside this range representing significant (Pdiff<0.05) differential effects. Error bars represent 95% CIs for the z score.

