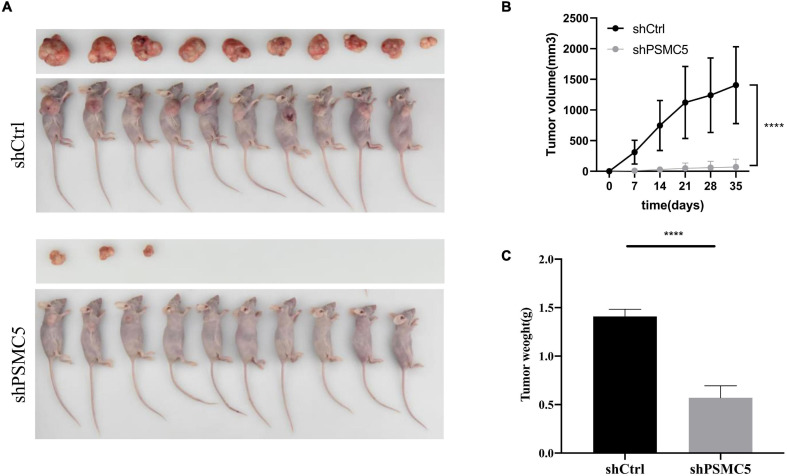
FIGURE 3.
Effects of PSMC5 knockdown on tumor growth in vivo. (A) Images of tumors in nude mice. (B) Tumor volume measured per week in different groups. p values were calculated by one-way ANOVA test. ****p < 0.0001. (C) Tumor weight in shCtrl and shPSMC5 groups. p value was determined by Student’s t-test. ****p < 0.0001.

