Figure 1.

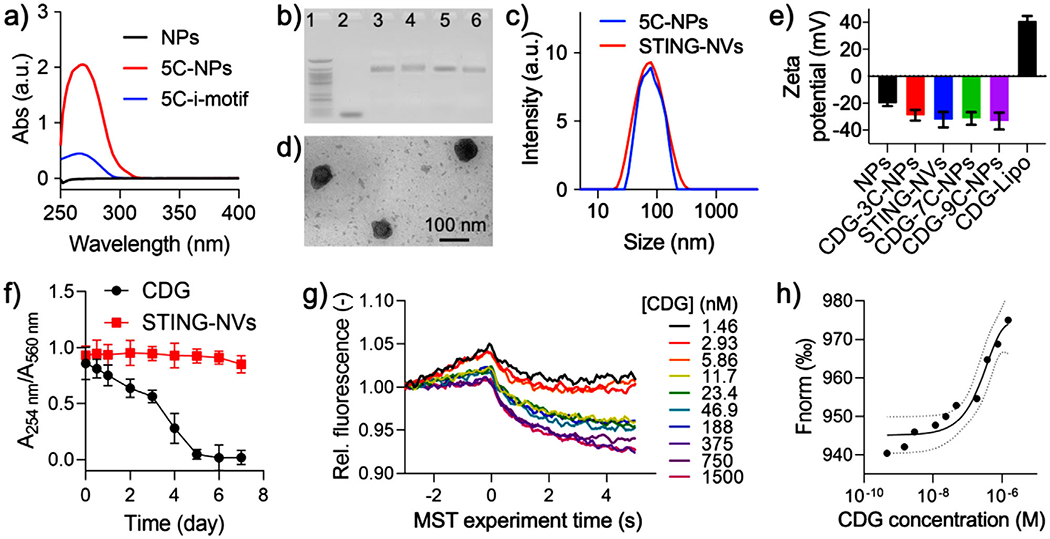
Characterization of STING-NVs. a) UV–vis absorbance spectra of PEG-b-PLA NPs, 5c-i-motif DNA, and 5c-NPs. b) An agarose electrophoresis image that showed conjugation of i-motifs on NPs. Lane legends: 1) 25 bp DNA ladder; 2) 9C-i-motif; 3) 3C-NPs; 4) 5C-NPs; 5) 7C-NPs; 6) 9C-NPs. c) DLS graphs showing the hydrodynamic diameters of 5C-NPs (79 ± 34 nm, PDI 0.157) and STING-NVs (81 ± 32 nm, PDI 0.131). d) A TEM image of STING-NVs. e) Zeta potential of blank NPs, CDG-loaded NPs, and Lipo-CDG. STING-NVs: CDG-loaded 5C-NPs. f) Stability of free CDG and CDG loaded in STING-NVs over 7 day incubation in 10% FBS-supplemented cell culture medium (37 °C). A254nm: 254 nm absorption from CDG; A560nm: 560 nm absorption from medium as an internal reference. g) MST traces and h) fitting curve of the kinetic interaction between 5C-NPs and CDG at pH 7.4. Data represent mean ± standard deviation (SD) (n = 3).
