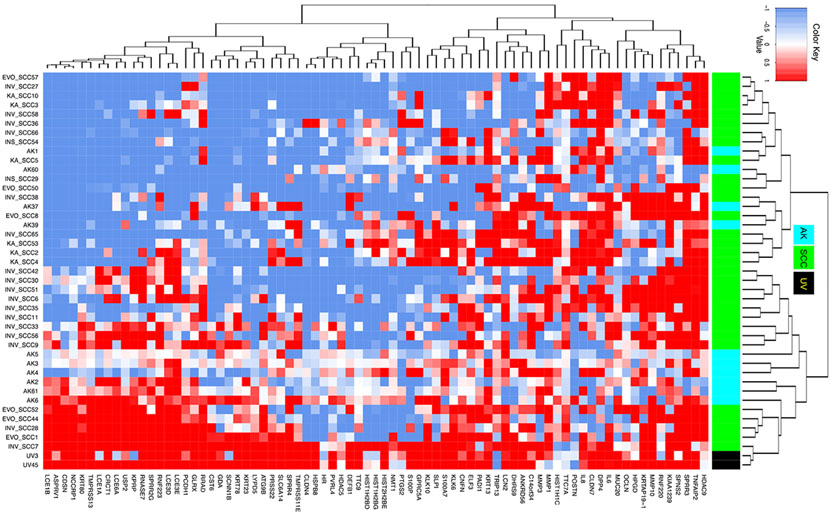
Figure 2.
Heatmap showing the gene expression signatures (log 2-fold change) of 77 genes in each of the UV, SCC, or AK samples versus their matched normal skin control. Red, white, and blue colors indicate over-expressed, not differentially expressed, or under-expressed genes, respectively. Black, cyan, and green colors in the sidebar represent UV, AK, and SCC samples, respectively.

