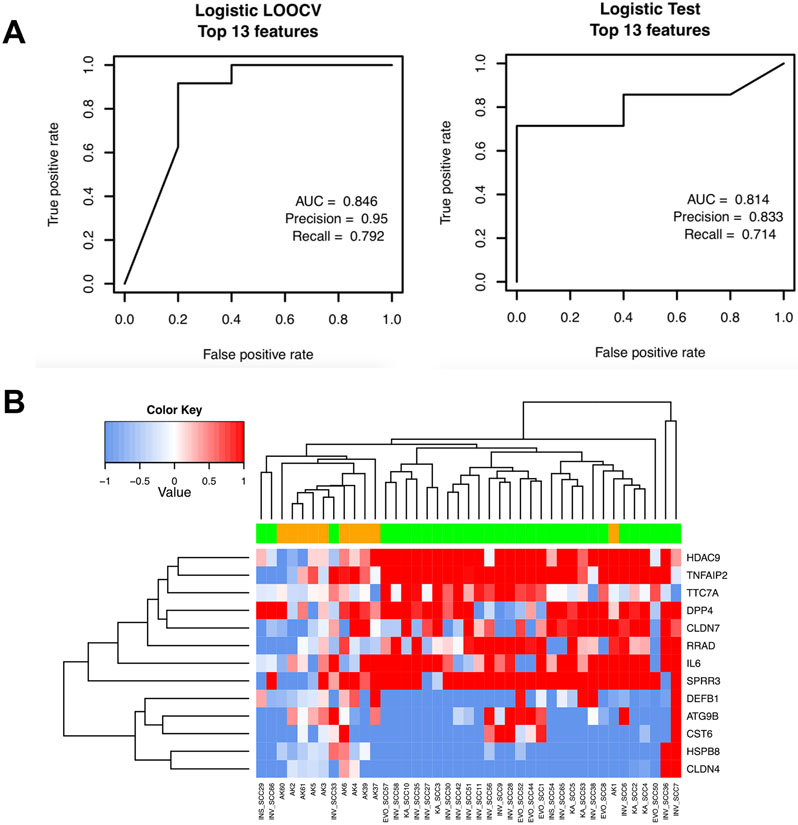
Figure 3.
A) Receiver-operating curves (ROC) curves showing the training and the testing performance of the Logistic regression model using the 29 training samples with LOOCV (left) and the 12 testing samples (right), respectively. B) Heatmap showing clustering of AK samples in orange and SCC samples in green based on the 13 features selected by the model.

