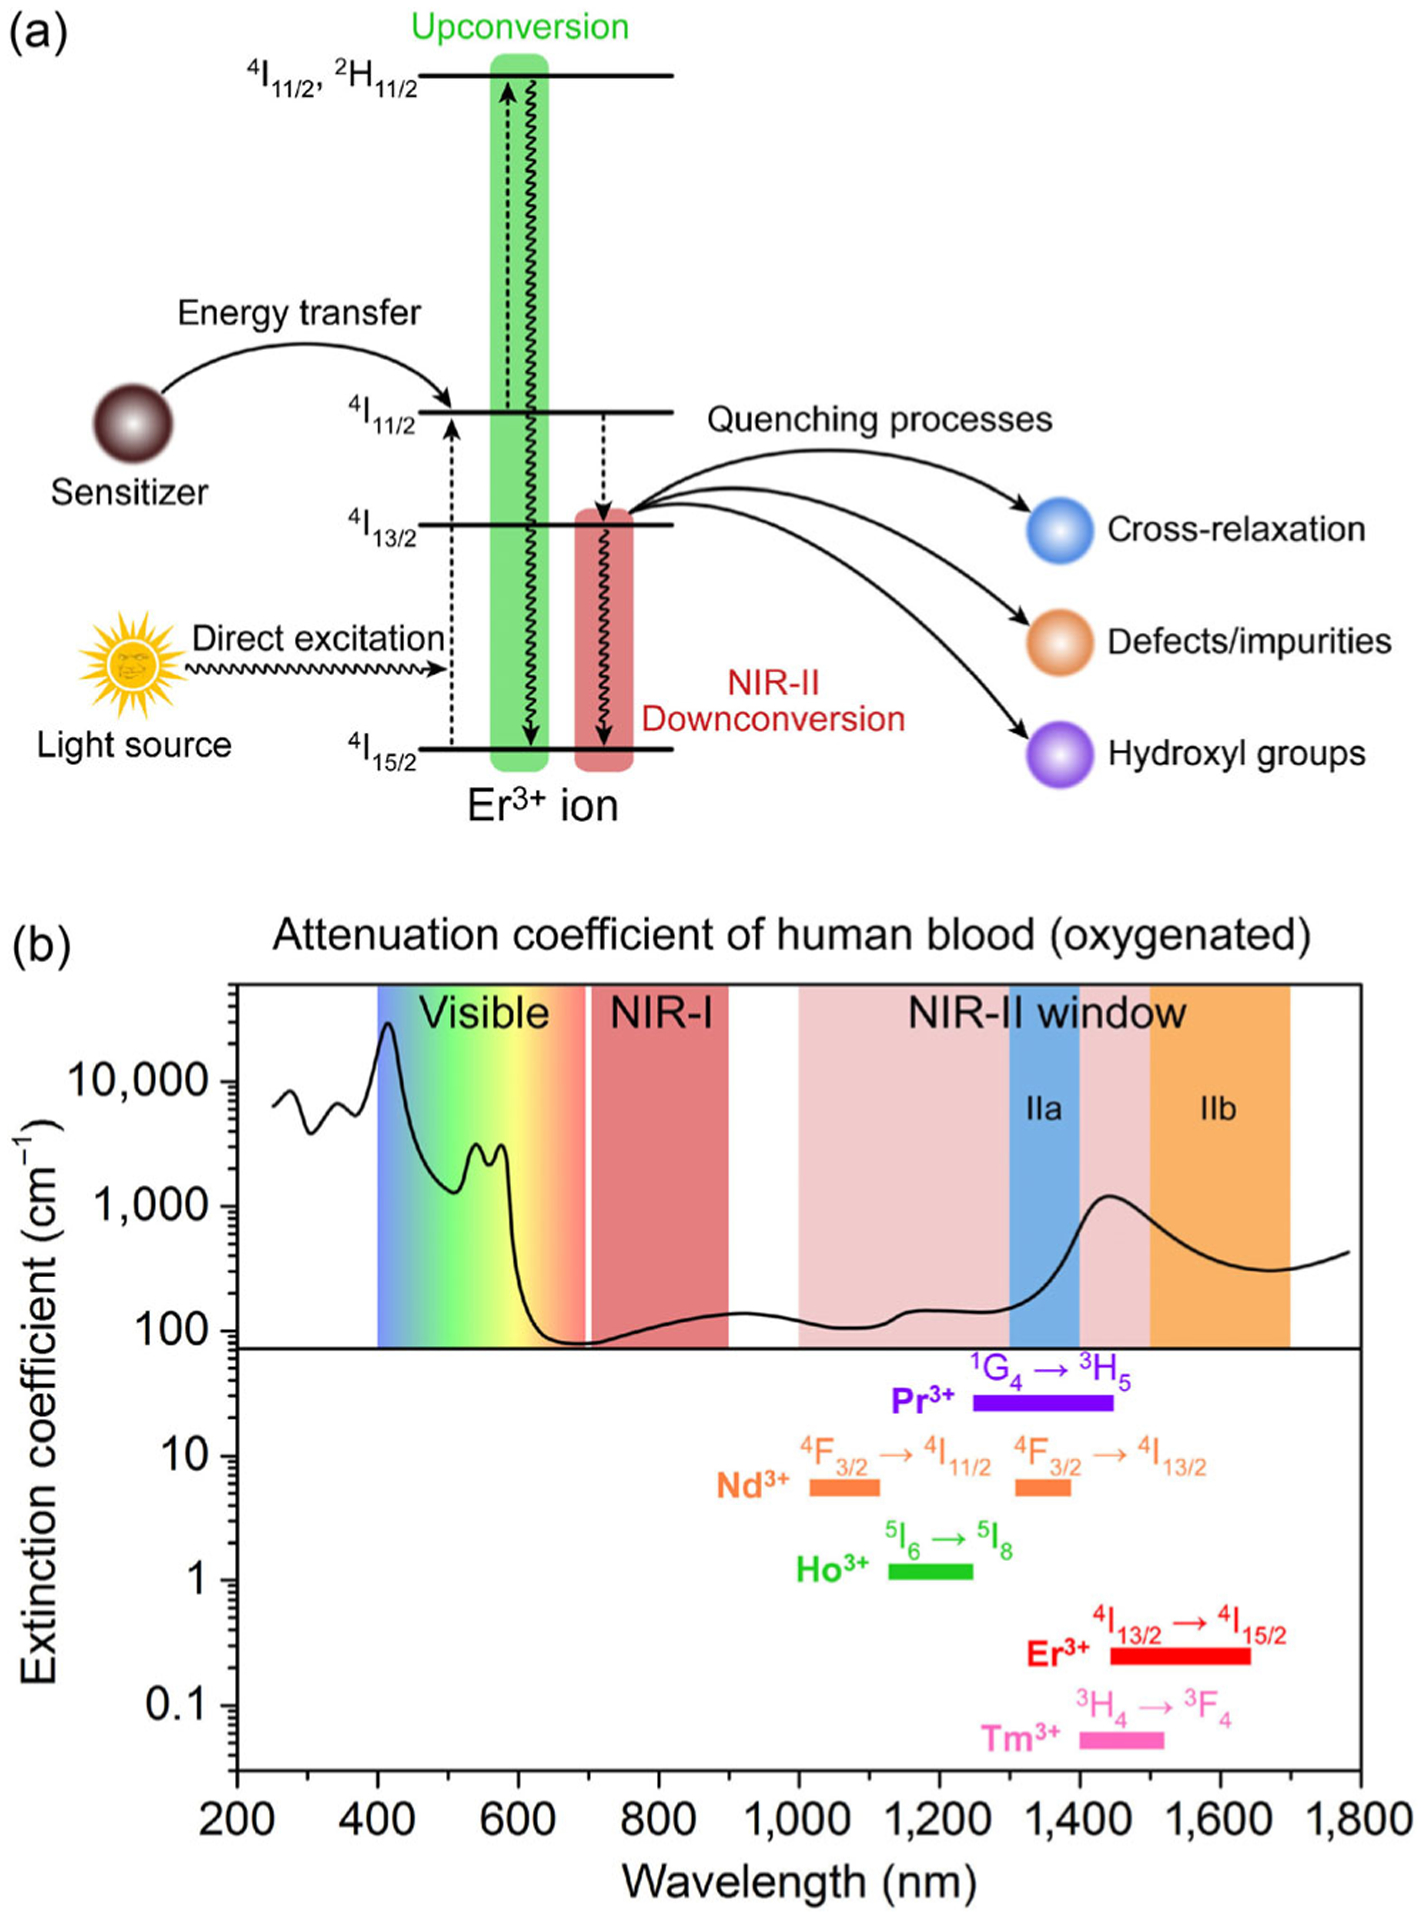
Figure 1.

(a) Simplified energy-level diagrams depicting the luminescence mechanism of Er3+ ion. (b) Attenuation coefficient of human blood (oxygenated) in the 300–1,700 nm spectral range. The spectral extensions of visible, NIR-I, and NIR-II (including NIR-IIa and NIR-IIb) imaging windows are schematically indicated. The emission spectral ranges of the different lanthanide ions are also included.
