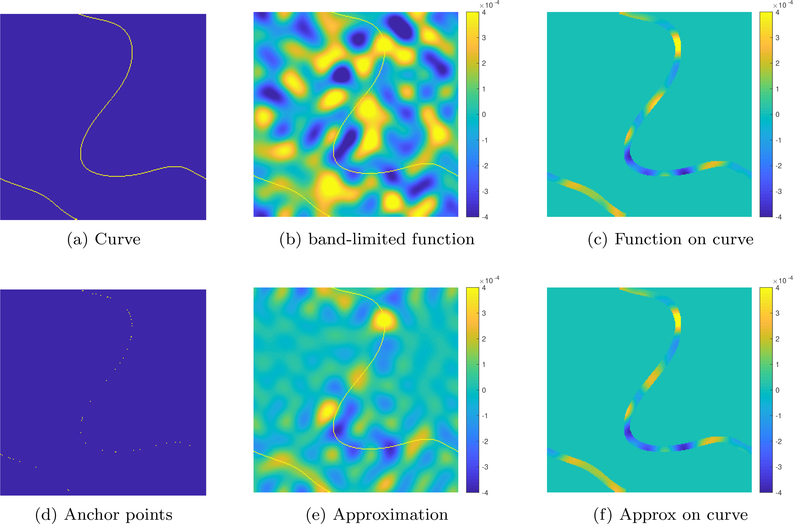
Figure 10:
Illustration of the local representation of functions in 2D. We consider the local approximation of the band-limited function in (b) with a bandwidth of 13 × 13, living on the band-limited curve shown in (a). The bandwidth of the curve is 3 × 3. The curve is overlaid on the function in (b) in yellow. The restriction of the function to the vicinity of the curve is shown in (c). Our results suggest that the local function approximation requires 132 − 112 = 48 anchor points. We randomly select the points on the curve, as shown in (d). The interpolation of the function values at these points yields the global function shown in (e). The restriction of the function to the curve in (f) shows that the approximation is good.

