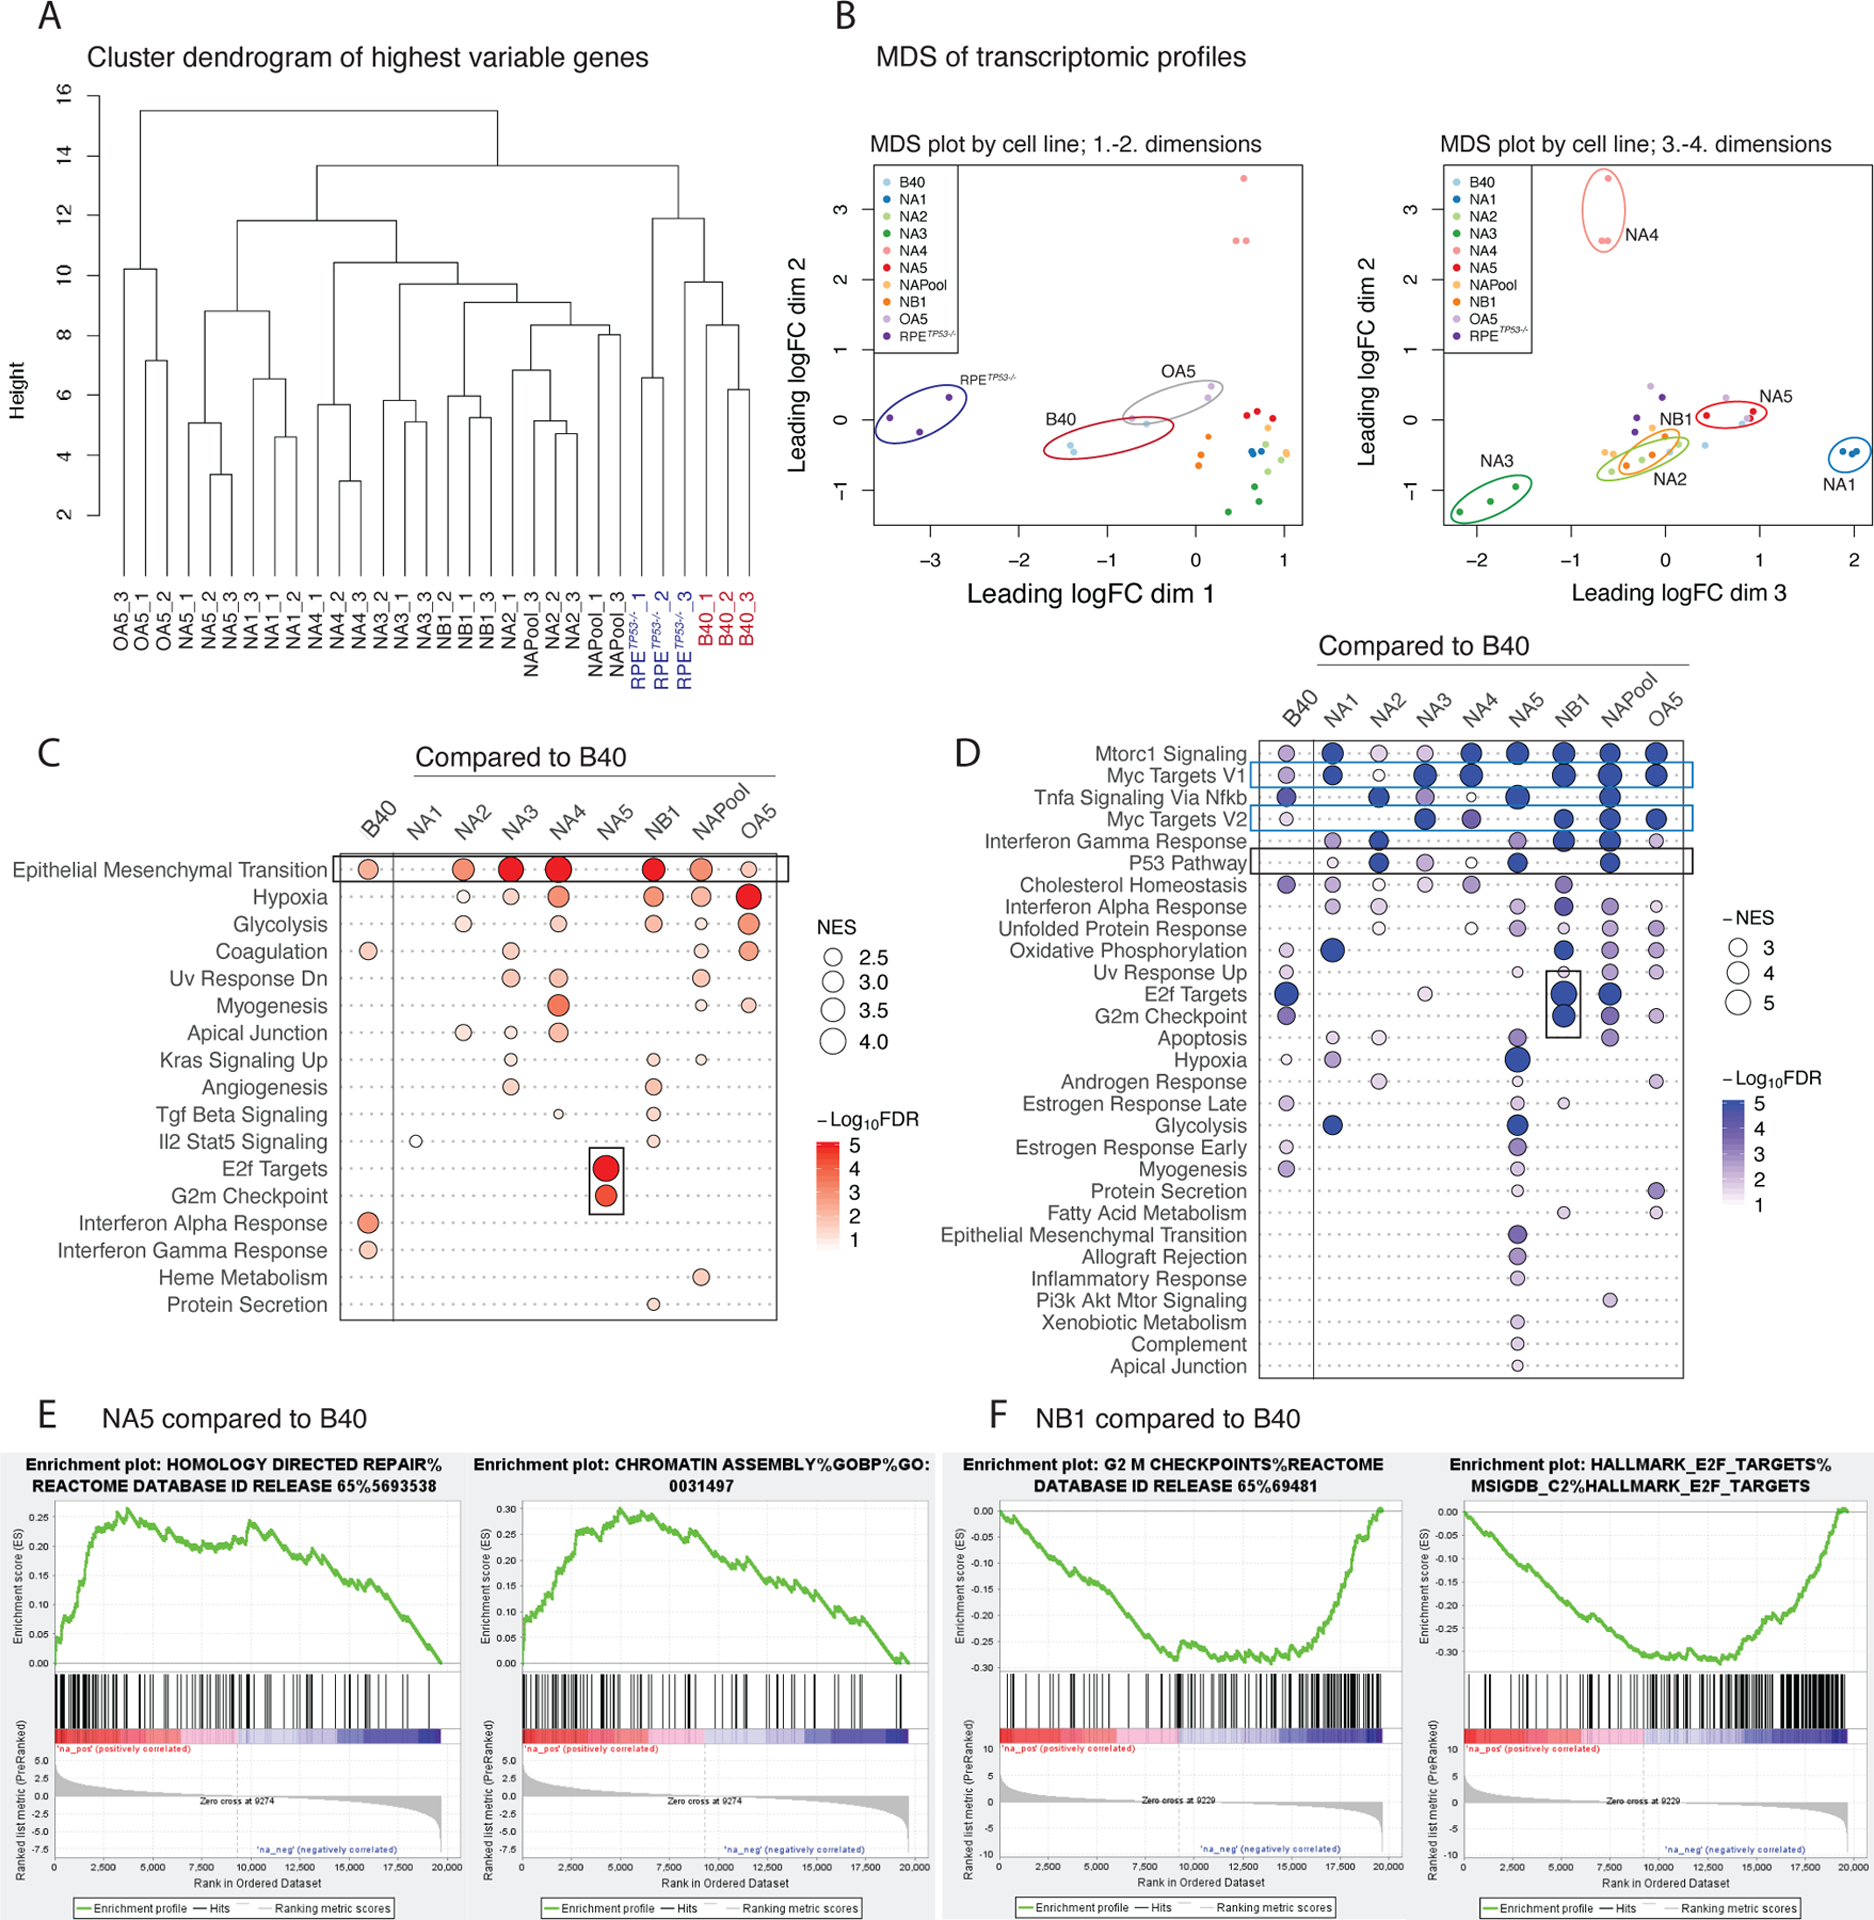
Figure 3. PARPi resistant clones have unique gene expression profiles.

(A) Hierarchical clustering dendrogram of RNA expression profiles using the highest variable genes of the parental RPETP53−/− , B40 cells, NAPool, and the resistant clones in triplicates. RPETP53−/− and B40 cells, as well as the OA5 olaparib resistant cells form distinct clusters, whereas the Niraparib resistant clones separate later in the dendrogram.
(B) Multi-dimensional-scaling (MDS) plots of the mRNA expression profiles of the cells in triplicates. Over dimensions 1 and 2 (left panel), the RPETP53−/−, , B40, and OA5 separate from the Niraparib resistant clones. Over dimensions 2 and 3 (right panel), the resistant clones further present with distinct transcriptomic profiles. The distances in the MDS plots represent the leading log-fold-change between each pair of samples.
(C) Summary plot of the positively enriched genes of the Hallmark pathways in GSEA in B40 compared to the RPETP53−/− and in the resistant clones compared to the sensitive B40 cell line. Positive enrichment of epithelial to mesenchymal transition (EMT) was observed in the B40 cells as compared to the RPETP53−/− cells, and in six out of the seven PARPi resistant clones (upper black rectangle). In addition, NA5 showed enrichment of G2M Checkpoint and E2F target- genesets (lower black rectangle). The size of the dots represents the positive normalized enrichment score (NES) and red color intensity indicates the -Log10 FDR with <0.01 as the cut-off.
(D) Summary plots of the negative NES (-NES) of the Hallmark pathways in GSEA in B40 compared to the RPETP53−/− and in the resistant clones compared to the sensitive B40 cell line. Overall, a larger number of significant negatively enriched pathways were seen in the resistant clones compared to B40. Common downregulated pathways included MYC targets (blue rectangles) and p53 (upper black rectangle) pathways. NA5 clone had the largest number of significantly negatively enriched pathways, and in contrast to NA5, G2M checkpoint and E2F target pathways were negatively enriched in the NB1 clone (lower black rectangle). The size of the dots represents the -NES and blue color intensity indicates the -Log10 FDR with <0.01 as the cut-off.
(E) Enrichment plot of NA5 clone showed upregulation of HR- DNA repair genes (left panel) and Chromatin regulatory genes (right panel) as compared to the B40 cell line.
(F) Enrichment plot of NB1 clone showed downregulation of G2M checkpoint genes (left panel) and E2F target genes as compared to the B40 cell line.
