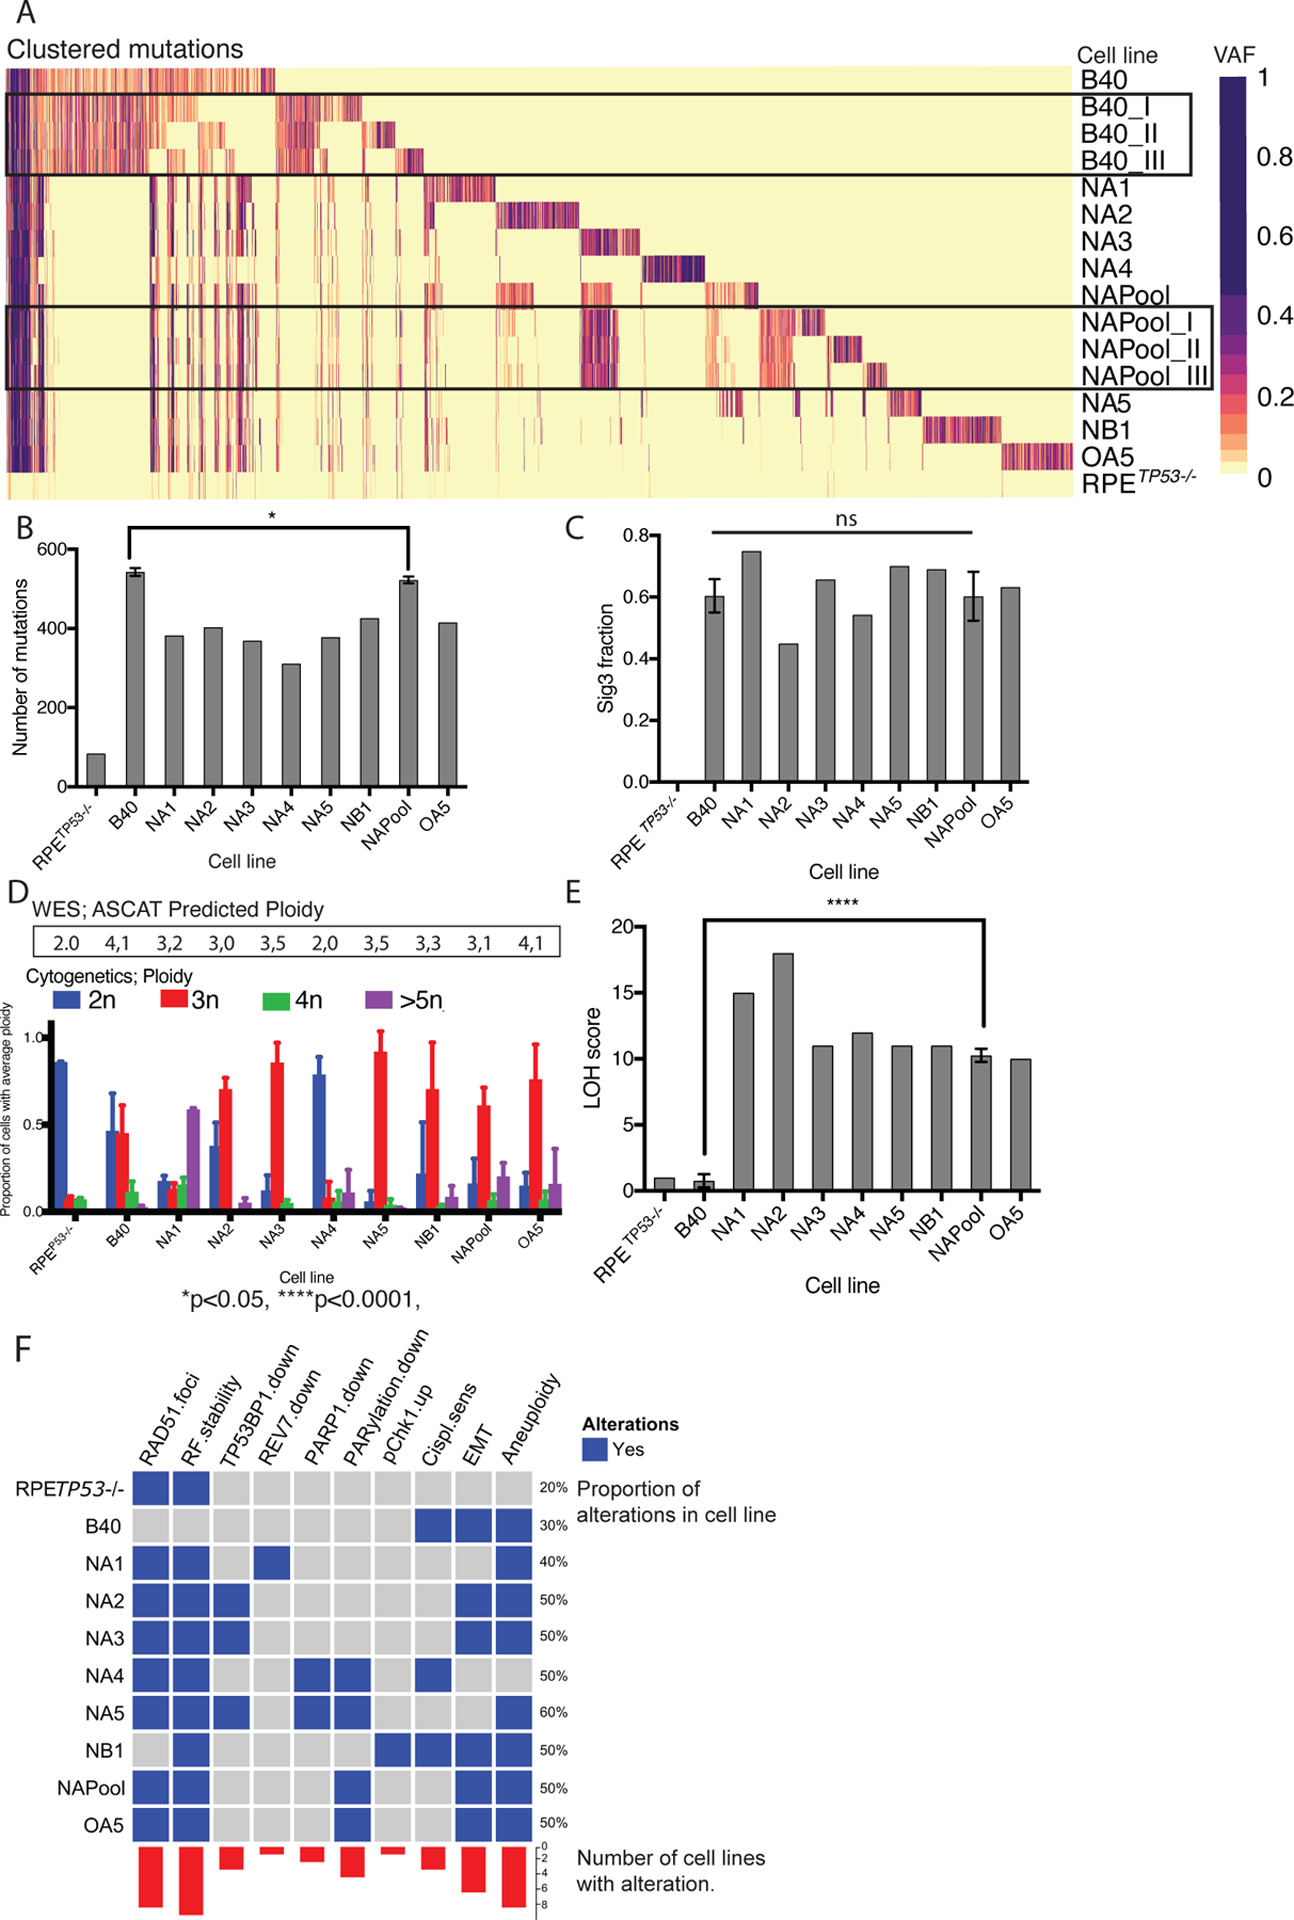
Figure 4. PARPi resistant clones have unique mutational profiles and are characterized by increased ploidy and LOH.

(A) Heatmap of mutational clusters by cell line. Mutational clustering revealed an a priori highly heterogenous mutational profile in the B40 cell line (three different regions sampled from the same tissue culture plate: B40_I, B40_II and B40_III), whereas the resistant NAPool showed more similar mutational clusters across regions (NAPool-I , NAPool-II and NAPool_III). Each single-cell derived resistant clone had unique mutational clusters. VAF; Variant allele frequency.
(B) The PARPi resistant clones had more mutations in comparison to the RPETP53−/− cell line, but less mutations in comparison to the B40 cell line. Bar graph of numbers of called mutations by cell line, error bars represent the SD. Groups of triplicate measurements (B40 and NAPool) were compared using Mann-Whitney U-Test. *p<0.05.
(C) The fraction of mutational Signature 3 was enriched in the B40 cell line. Two out of seven PARPi resistant clones had decreased fractions of Sig3, however there was no significant difference between the B40 cells and the NAPool. Error bars represent the SD. Groups of triplicate measurements (B40 and NAPool) were compared using Mann-Whitney U-Test. *p<0.05.
(D) WES predicted ploidy (black rectangle) was consistent with the cytogenetic analysis of ploidy using chromosome counting in metaphase spreads of the cells. The cytogenetic ploidy is shown as bar plots of proportion of cells with average ploidy (2n, 3n 4n or >5n). Error bars represent the SD.
(E) Barplot of Loss of Heterozygosity (LOH) scores showing higher scores in the PARPi resistant clones compared to the sensitive B40 cells. Error bars represent the SD. Groups of triplicate measurements (B40 and NAPool) were compared using Mann-Whitney U-Test. ****p<0.0001.
(F) Oncoprint figure summarizing the functional and genomic findings of the cell lines.
