
Figure 6. PARPi resistant clones show S/G2 arrest and DNA damage upon PARPi re-challenge and vulnerability to targeted agents.
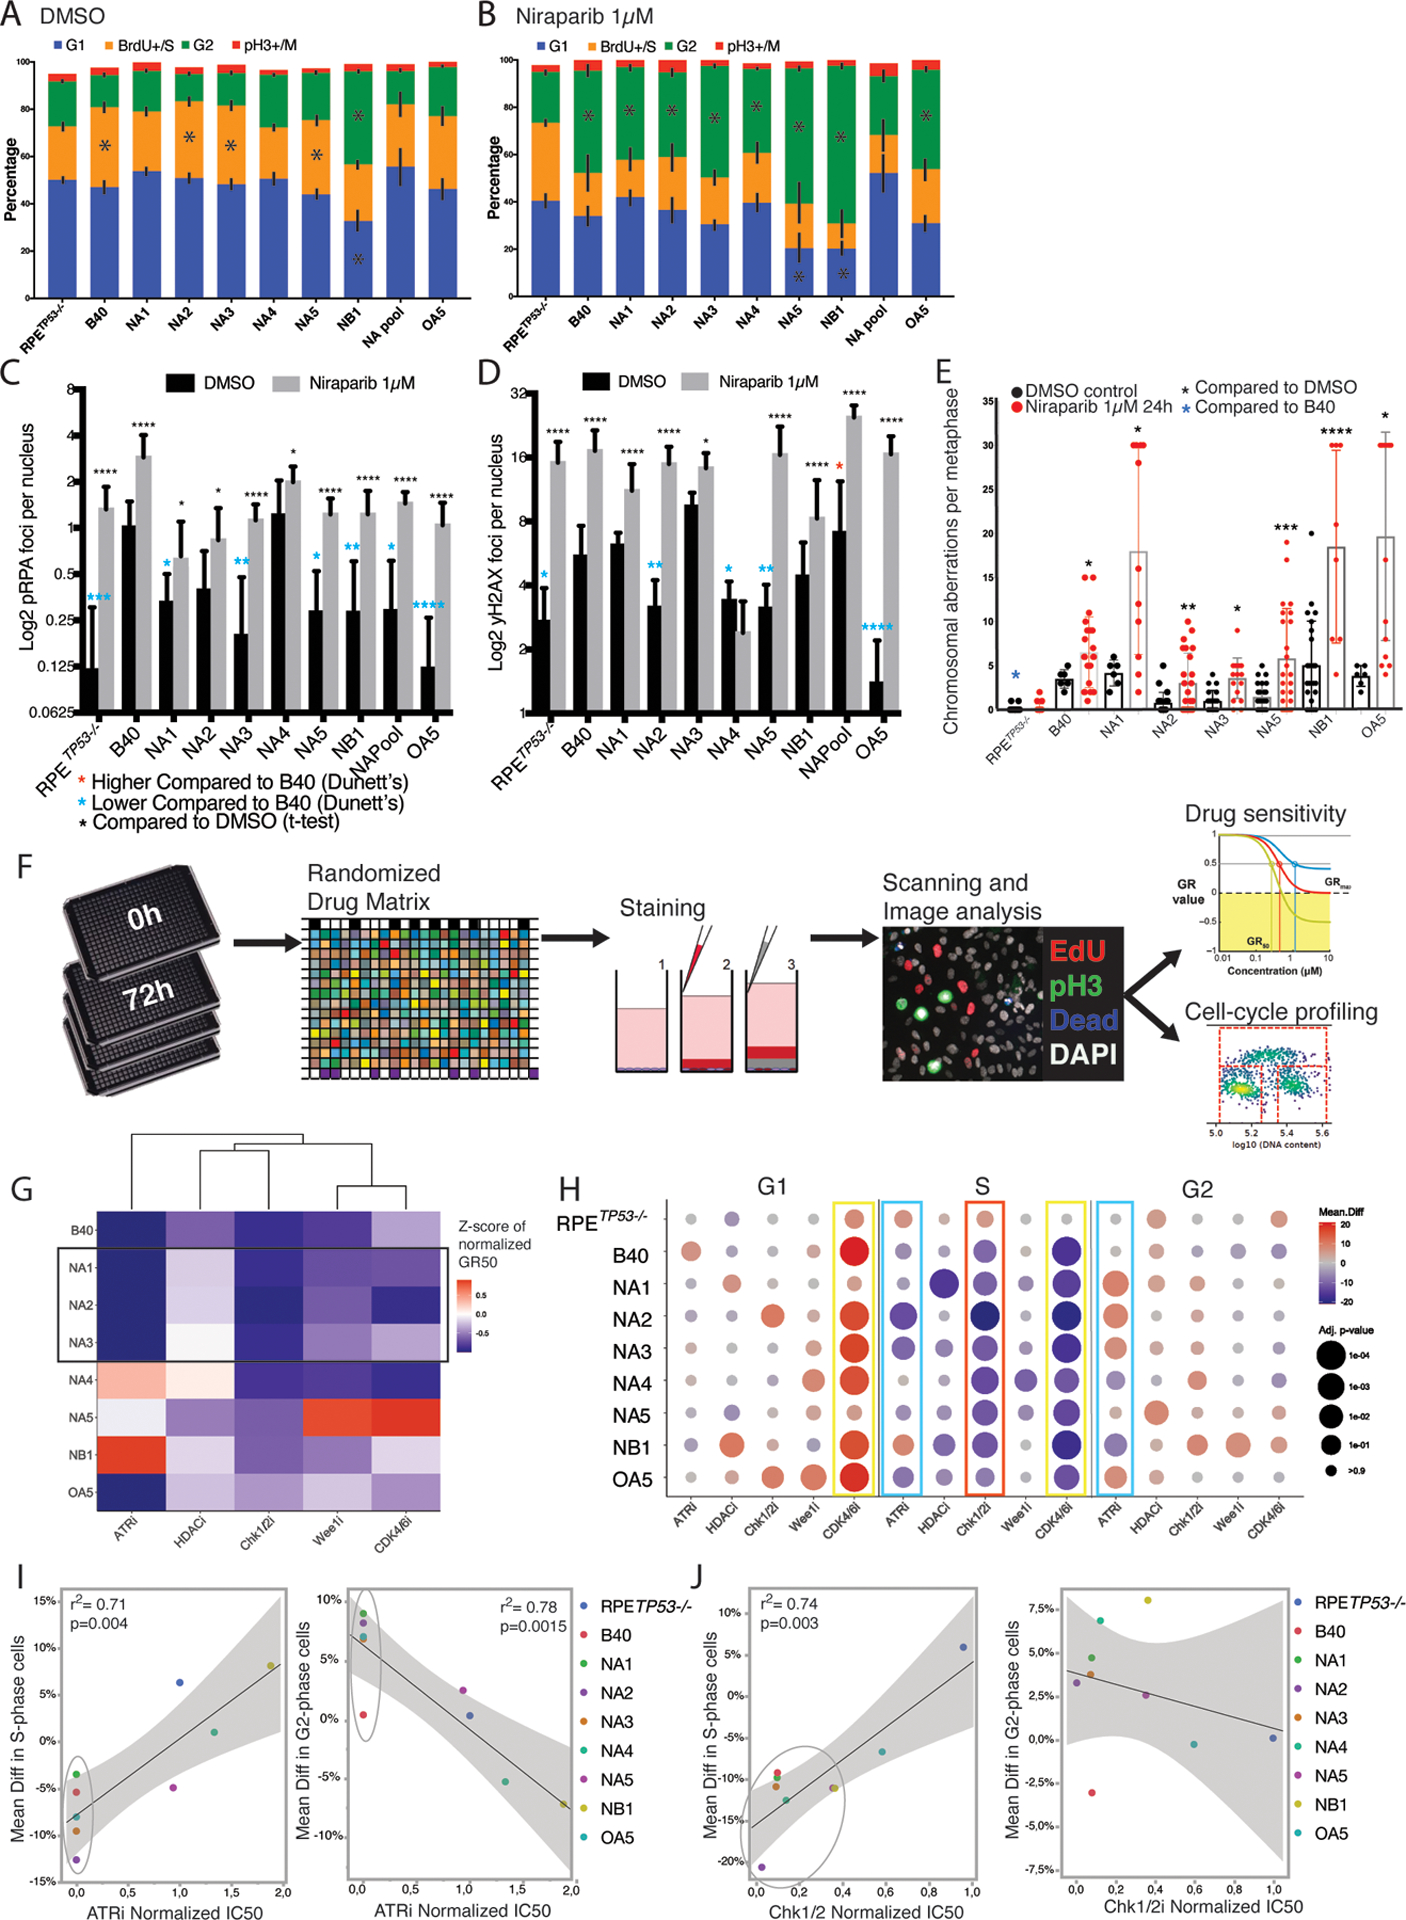
(A) Cell cycle analysis based on DNA content and BrdU incorporation in Flow-cytometry indicated prolonged S-phase at baseline in the sensitive B40 cell line and three out of seven PARPi resistant clones when compared to the RPETP53−/− cells. Black bars indicate SD of three independent measurements, asterisks indicated significant difference with p<0.05 (Mann-Whitney-U test) in comparison to the RPETP53−/−.
(B) Cell cycle analysis revealed a marked G2 arrest in response to Niraparib treatment (1μM for 24 hours) in the sensitive B40 and also in all of the PARPi resistant clones.
(C) Quantification of pRPA (S32) foci at baseline (black bars) and after Niraparib (1μM for 24 hours, grey bars) using IF showed baseline lower levels in the RPETP53−/− cells and in all resistant clones except NA4 in comparison to B40 (blue asterisks). In addition, all resistant clones showed an increase in pRPA after Niraparib treatment. Data are presented as mean foci per nucleus per image in 5–10 representative images and error bars represent the SD.
(D) Quantification of γH2AX foci using IF showed lower baseline DNA damage in comparison to B40 (blue asterisks) in four out of seven clones, however γH2AX foci were significantly higher after Niraparib treatment in all PARPi resistant clones, except for clones NA3 and NA4 (black asterisks).
(E) All PARPi resistant clones displayed increased chromosomal aberrations in metaphase spreads after treatment with Niraparib (1μM for 24 hours). At baseline, the resistant clones had on average similar numbers of chromosomal aberrations, whereas RPETP53−/− cells had lower numbers of aberrations compared to the B40. Bar graphs represent the Mean and error bars the SD.
(F) Schematic presentation of the workflow used in the drug screening. Cells were plated on 384-well plates in triplicates. On day 1 the control plates (0) were fixed and treated with increasing concentrations of the drugs on a randomized order using an automated drug dispenser. After 72 hours the cells were pulsed with EdU, fixed and stained using live-dead stain and a pH3 antibody for viability and cell cycle analysis. The plates were scanned, and the imaging data for growth-rate normalized survival and cell cycle profiles were analyzed using designed pipelines.
(G) Heatmap of IC50 values normalized to the RPETP53−/− cells of the selected drugs in the cell lines and resistant clones. Resistant clones with mechanisms related to increased end resection (NA1, NA2 and NA3) showed similar drug response profiles (black rectangle). Other clones had unique response profiles, with no single drug being as effective in all clones as in the as in the B40 cells.
(H) Cell cycle profiles were extracted from the drug screening image analysis and presented as the mean difference in the treated wells in comparison to the untreated wells (Mean difference in % of cells) for G1 (left panel), S (middle panel), and G2 (right panel) phases. The data are presented as dot plots with the mean difference calculated from three independent wells in color scale and p-value as the size of the dot (Sidak’s multiple comparison test and p-value <0.1). Note the increase in G1, and decrease in S phase as a response to CDK4/6 inhibition (yellow rectangles). ATR inhibition resulted in significant decrease in proportion of cells in S-phase (left blue rectangle) and increase in G2 (right blue rectangle) in the sensitive cell lines. Chk1/2 inhibition caused a decrease in S-phase cells (red rectangle).
(I) Linear regression of the mean differences in S (left panel) and G2 (right panel) phases after ATR inhibition. The sensitive cells (circles) showed a significant decrease in S and increase in G2.
(J) Linear regression of the mean differences in S (left panel) and G2 (right panel) phases after Chk1/2 inhibition. The sensitive cells (circles) showed a significant decrease in S but no significant correlation was observed for G2.