. 2020 Nov 10;50(1):556–568. doi: 10.1039/d0cs00855a

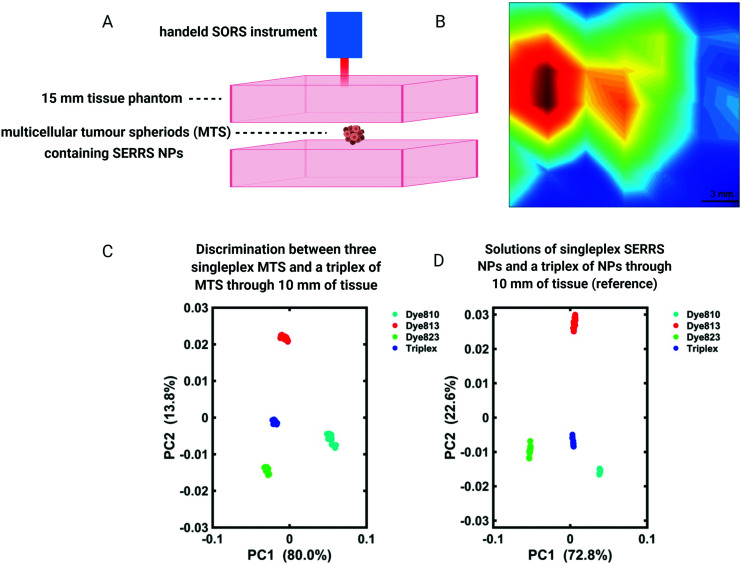
Fig. 7. (A and B) A false colour xy-2D heat SESORRS map of MTS containing SERRS NPs through 15 mm of tissue using a handheld spectrometer. Mapping was performed using a 3 mm step size to create an image of 7 × 7 pixels. (C and D) PC scores plots discriminating between single SERRS NP flavours and a triplex of all three SERRS flavours within (C) MTS and (D) solution through 10 mm of porcine tissue. Distinct separation is observed in both score plots. All measurements were carried out using a 2 s integration time, 5 accumulations, 830 nm laser excitation wavelength. Adapted from ref. 105 and 106 with permission from the Royal Society of Chemistry, copyright 2018.

Fig. 7