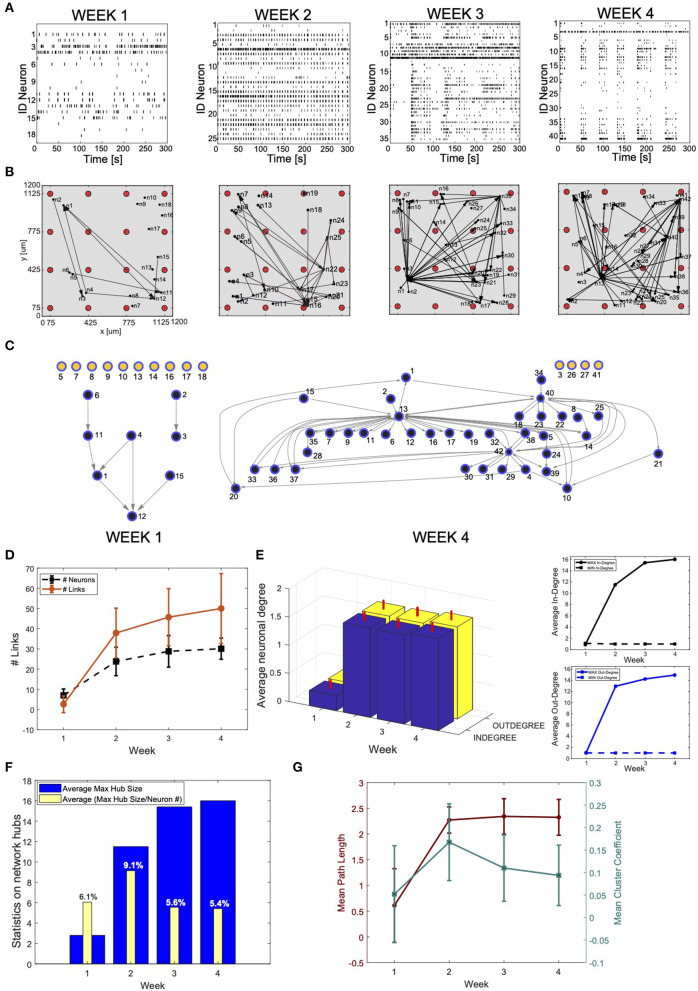
Figure 5.
Connectivity reconstruction from neural recordings of developing induced pluripotent stem cells (hiPSC)-derived neurons. (A) Raster plots of the same MEA well at different time points during development: week 1, 2, 3, and 4 after plating. The four panels shows spiking signals from individual neurons (rows) obtained through spike sorting, principal component analysis (PCA), and k-means clustering of 300-s recordings. The culture develops complex network features: from weakly active and randomly organized (individual spiking events), to very active and fully organized (network bursts). (B) Estimated effective connectivity of the developing culture whose activity is described in (A). Each visual map consists of a 1.2 ×1.2 mm multi-electrode array (MEA) plate (gray area), a 4-by-4 array of micro-electrodes (red circles) and the estimated directed connections (black arrows). The active neurons are represented by black dots; they are randomly distributed around their corresponding sensing electrode within a radius of 50 μm. (C) Directed graph relative to the culture at week 1 and 4. The connectivity is equivalent to the one visualized in B but, for clarity and consistency with the main text, links between neurons are directed edges (arrows), active neurons are network nodes (blue: connected; yellow: independent). Given a MEA well and a specific time point, indexes refer to active neurons with recorded activity reported in (A). Note that neurons mapped at week 1 do not correspond to neurons mapped in the following weeks, although they are indicated with the same indexes. (D–G) Graph theory based analysis of network connectivity in developing hiPSC-derived neuronal-network. (D) Average number (N = 20) of active neurons (black) and detected connections (red) in MEA wells recorded at week 1, 2, 3, and 4 after plating. The error bars represent the standard deviations for a dataset of 20 different MEA wells. (E) (Left panel) Statistics (N = 20) on the neuronal in-degree (number of input connections) (blue) and out-degree (number of output connections) (yellow). The vertical red bars stand for the standard deviations of in-degree and out-degree data. (Right panel) Average maximum (continuous line) and minimum (dashed line) in-degree (top) and out-degree (bottom). The number of in- and out- degree is equally distributed with equivalent raising behavior as a function of the cultures' developmental stage. (F) Statistics on network hubs as a function of the culture's age. In blue, average (N = 20) maximum hub size. We used the in-degree centrality measures for hub detection and characterization. In yellow, percentage of neurons that function as network hubs relative to the total number of active neurons in the well (value averaged over 20 wells). More mature networks include few super-hubs (~5% of the total number of neurons) with increase in size as demonstrated by the raising number of incoming connections at week 3 and 4. (G) Characterization of network segregation and integration properties. Values in the graph correspond to the mean path length (PL) and mean clustering coefficient (CCo) calculated for each well at week 1, 2, 3, and 4 after plating and then averaged over 20 wells. The error bars correspond to the standard deviation of 20 different measures. The mean PL corresponds to the average shortest path length in the networks. Infinite (absent) connections between neurons were not considered in its calculation. The PL is very low for highly immature cultures where only sparse activity from individual neurons was mainly registered. It increases as soon as connections are formed (week 2) but no longer changes with the number of new connections (week 2, 3, and 4). The cluster coefficient (CCo) is low and decreases with the maturation of the network as indication of favored segregation vs. integration with increasing number of independent but highly integrated network units (hubs).

