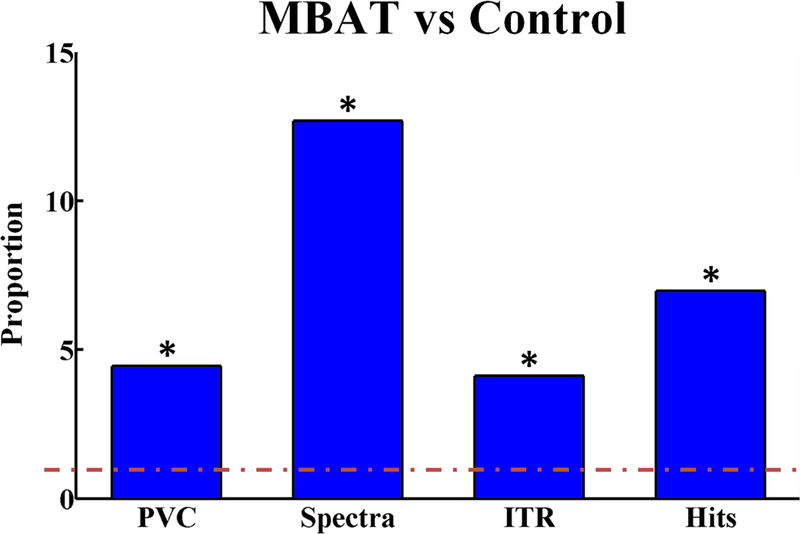
Figure 8.
The ratios of weighted average slope measures for MBAT subject left-right performance as compared to control subject performance. The red, dashed line at 1 indicates no difference between the two cohorts evaluated. A star indicates a statistically significant difference between the MBAT and control cohorts. (Based on work from [164])

