Abstract
Background
The study aimed to investigate the expression of OVOLs in breast cancer (BRCA) tissues and their value in prognosis.
Methods
ONCOMINE was used to analyze the expressions of OVOL1, OVOL2, and OVOL3 mRNA between BRCA tissues and normal breast tissues. The Wilcoxon rank sum test and t-test were used to assess the expression of OVOLs between BRCA tissues and unpaired/paired normal breast tissues. GEPIA and ROC curves were used to analyze the relationship between OVOLs expression and clinical pathological stage. Kaplan–Meier plotter was used to analyze prognosis. cBioPortal was used to analyze the mutation of OVOLs. GEPIA was used to analyze the co-expression of OVOLs. GO and KEGG analyses were performed by the DAVID software to predict the function of OVOLs co-expression genes.
Results
The expression of OVOL1/2 was significantly higher in BRCA tissues than in normal breast tissues. The OVOL3 expression correlated with tumor stage. The AUC of OVOLs was 0.757, 0.754, and 0.537, respectively. OVOL1 high expression was associated with shorter overall survival (HR: 1.48; 95% CI: 1.07–2.04; P=0.018). The OVOLs were associated with pathways including axon guidance, thyroid hormone signaling pathway, and ubiquinone and other terpenoid-quinone biosynthesis.
Conclusion
OVOL1 is a new potential marker of prognosis in BRCA, and OVOL1/2 are potential therapeutic targets in BRCA.
Keywords: OVOLs, breast cancer, prognostic, bioinformatics, gene expression
Introduction
Breast cancer (BRCA) is the most common malignancy in women and the leading cause of cancer deaths in women worldwide.1 Despite the prognostic benefits of local surgery, conventional chemotherapy, precision radiotherapy, endocrine therapy, and the use of monoclonal antibodies for BRCA patients.2,3 Prognosis of BRCA is predicted in relation to clinical, pathological, and molecular features.4 Molecular biomarkers have been identified as promising candidates not only to predict biological behavior and clinical outcomes, but also to help improve therapeutic options.5,6 Therefore, the identification of new prognostic markers could provide new insights into the early detection of BRCA and reduce mortality and recurrence.
Currently, there are no validated screening tests for early BRCA detection, and there is a need to explore genetic signatures associated with prognostic prediction of the underlying mechanisms of BRCA progression. Therefore, studying the prognostic value of OVOLs for patients with BRCA may help to improve the prediction of clinical prognosis in BRCA and inform personalized treatment.
OVOLs (OVO-like proteins) are universally conserved genes encoding C2H2 zinc finger transcription factors in mammals.7 OVOLs act as transcription factors to regulate gene expression in various differentiation processes.8 OVOLs contains three members, including OVOL1, OVOL2, and OVOL3. Epithelial-to-mesenchymal transition (EMT) plays a key role in the stromal invasion of tumor cells.9 Multiple signaling pathways and various molecules are involved in this process; OVOL1 and OVOL2, two transcription factors, have been identified as key guardians that inhibit EMT and facilitate its mirror process, mesenchymal to epithelial conversion.10,11
In recent years, OVOLs are associated with clinical staging, EMT, tumor metastasis, can modulate cancer cell stemness, and are promising markers for prognostic prediction.11–17 However, the roles of OVOLs in BRCA are unclear. In this study, bioinformatics was used to analyze the potential of OVOLs as a predictor of breast carcinogenesis and their regulatory network.
Materials and Methods
Differential Expression of OVOLs
Oncomine (https://www.oncomine.org/resource/login.html) were used to analyze the levels of OVOLs mRNAs in BRCA tissues and normal tissues.18 The screening criteria were P<0.05, fold change>1.5, and Top 10% of gene rank.
Software: R (version 3.6.3) (statistical analysis and visualization). R package: mainly ggplot2 (for visualization). Molecules: OVOL1 [ENSG00000172818], OVOL2 [ENSG00000125850], and OVOL3 [ENSG00000105261]. Data: RNAseq data in level 3 HTSeq-FPKM format from the TCGA (https://portal.gdc.cancer.gov/) BRCA (breast invasive carcinoma) project. Extracted BRCA of TCGA and corresponding normal tissue data in GTEx. Data filtering: None or retain paired samples. Data conversion: RNAseq data in FPKM (Fragments Per Kilobase per Million) format converted to TPM (transcripts per million reads) format and log2 transformed. Significance markers: ns, p≥0.05; *p< 0.05; **p<0.01; ***p<0.001.
The Relationship Between OVOLs and Clinical Characteristics of BRCA
GEPIA (http://gepia.cancer-pku.cn/) was used to do OVOLs expression analysis.19 The expression of OVOLs at different clinical stages was generated online. The co-expression genes of OVOLs were generated online.
ROC curves. Software: R (version 3.6.3). R packages: mainly the pROC package (for analysis) || ggplot2 package. Molecule: OVOL1/2/3. Clinical variables: Tumor vs Normal. Data: UCSC XENA RNAseq data in TPM format for TCGA and GTEx processed uniformly by the Toil process.20 Extracted BRCA for TCGA and corresponding normal tissue data in GTEx. Data filtering: None. Data transformation: RNAseq data in TPM format and log2 transformed for analysis.
The Relationship Between OVOLs and Prognosis of BRCA
Kaplan–Meier Method. Software: R (version 3.6.3). R package: survminer package (for visualization), survival package (for statistical analysis of survival data). Molecule: OVOL1/2/3. Subgroups: 0–50 vs 50–100. Prognosis type: Overall Survival, Disease specific Survival, and Progression-free Survival. Data: RNAseq data and clinical data in level 3 HTSeq-FPKM format from the TCGA BRCA project. Data filtering: Retain data with clinical information. Data conversion: RNAseq data in FPKM format were converted to TPM format and analyzed by grouping them according to molecular expression. Additional data: prognostic data from an article.21
The Mutation and Co-Expression of OVOLs in BRCA
cBioPortal (http://www.cbioportal.org/index.do?session_id= 5b4c1773498eb8b3d566f7b8) was used to analyze the mutation of OVOLs in BRCA.
GO and KEGG Analysis
DAVID database was used to do Gene Ontology (GO) and Kyoto Encyclopedia of Genes and Genomes (KEGG) analysis for the co-expression genes of OVOLs, including BP (biological process), MF (molecular function), CC (cellular component), and pathway analysis.22
Statistical Analysis
All statistical analyses were performed using R (v.3.6.3). The expression of OVOLs between BRCA tissue and normal breast tissue was analyzed using the Wilcoxon rank sum test. The expression of OVOLs between BRCA tissues and paired normal breast tissues was analyzed using t-test. P values less than 0.05 were considered statistically significant.
Results
OVOLs Expression in BRCA and Normal Breast Tissues
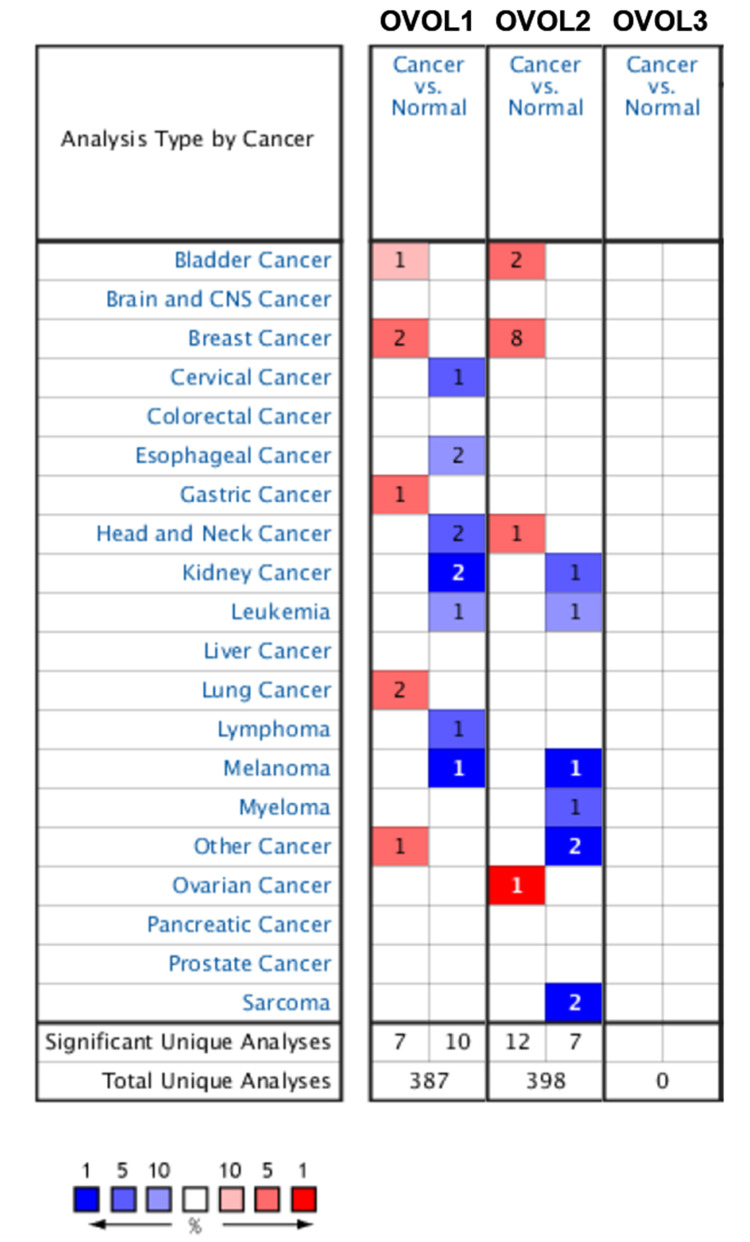
As shown in Figure 1 and Table 1, OVOL1/2 mRNA expression in BRCA tissues was significantly higher than that in normal breast tissues (P<0.05). OVOL2 had the highest expression change (fold change=3.638, P<0.05), and 1 data set confirmed this.23
Figure 1.
The mRNA expression of OVOLs between cancer and normal tissues. Cell color is determined by the best gene rank percentile for the analyses within the cell. Red indicates an increase in expression, blue indicates a decrease in expression.
Table 1.
OVOLs Expression Differences Between BRCA and Breast Tissues in ONCOMINE Database
| OVOLs | Types of Ovarian Cancer vs Ovarian | P value | t-test | Fold Change |
|---|---|---|---|---|
| OVOL1 | Invasive Ductal and Lobular Carcinoma vs Normal | 4.12 E-5 | 5.695 | 3.447 |
| OVOL1 | Mixed Lobular and Ductal Breast Carcinoma vs Normal | 8.81 E-5 | 4.433 | 2.8535 |
| OVOL2 | Invasive Ductal and Lobular Carcinoma vs Normal | 2.05 E-8 | 6.262 | 3.279 |
| OVOL2 | Intraductal Cribriform Breast Adenocarcinoma vs Norma | 4.34 E-7 | 5.543 | 3.638 |
| OVOL2 | Mixed Lobular and Ductal Breast Carcinoma vs Normal | 1.75 E-5 | 4.843 | 3.091 |
| OVOL2 | Tubular Breast Carcinoma vs Normal | 2.22 E-25 | 11.879 | 2.459 |
| OVOL2 | Invasive Ductal and Invasive Lobular Breast Carcinoma vs Normal | 2.01 E-28 | 12.674 | 2.702 |
| OVOL2 | Mucinous Breast Carcinoma vs Normal | 3.33 E-14 | 8.523 | 2.369 |
| OVOL2 | Invasive Lobular Breast Carcinoma vs Normal | 8.23 E-28 | 12.444 | 2.578 |
| OVOL2 | Invasive Breast Carcinoma vs Normal | 9.67 E-5 | 4.320 | 2.168 |
| OVOL3 | NA | NA | NA | NA |
Relationship Between OVOLs Expression and the Clinical Stage of BRCA
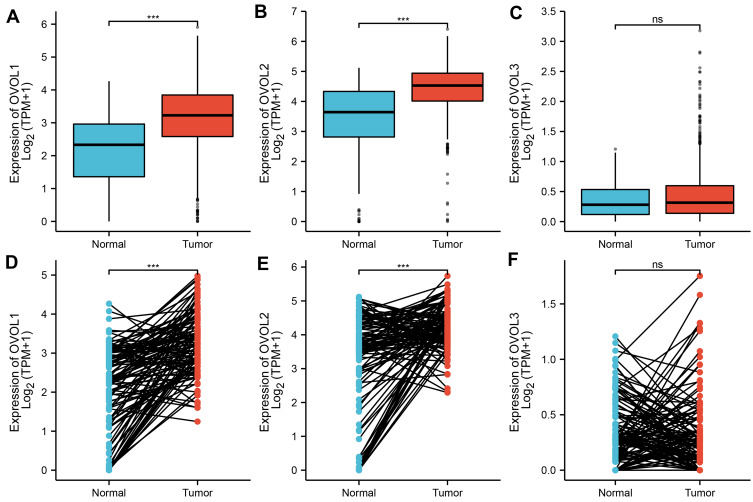
As shown in Figure 2, the OVOL1 expression in BRCA tissues was significantly higher than that in normal BRCA tissues (3.167±0.030 vs 2.114±0.103, P<0.001), the OVOL1 expression in BRCA tissues was significantly higher than that in matched normal breast tissues (3.271±0.075 vs 2.111±0.104, P<0.001); the OVOL2 expression in BRCA tissues was significantly higher than that in breast tissues (4.416±0.023 vs 3.271±0.139, P<0.001), the OVOL1 expression in BRCA tissues was significantly higher than that in matched normal breast tissues (4.253±0.060 vs 3.259±0.140, P<0.001); there was no significant difference in OVOL3 between BRCA tissues and normal breast tissues (0.438±0.013 vs 0.0354±0.028, P=0.163); there was no significant difference in OVOL3 between BRCA tissues and matched normal breast tissues (0.363±0.034 vs 0.0354±0.028, P=0.069). OVOL3 was correlated with the clinical stage of BRCA (Figure 3). The results suggested OVOL3 may be closely related to the development of BRCA. The area under curve (AUC) of OVOLs was 0.757, 0.754, and 0.537, respectively, suggesting that OVOL1/2 could be served as ideal biomarkers to distinguish BRCA from nontumor tissue (Figure 4).
Figure 2.
The expression of OVOLs in normal breast tissue and that of BRCA tissues. The difference expression of (A) OVOL1, (B) OVOL2, and (C) OVOL3 in BRCA tissues and normal breast tissues. The difference expression of (D) OVOL1, (E) OVOL2, and (F) OVOL3 in BRCA tissues and paired normal breast tissues. Significance markers: ns, p≥0.05; *p< 0.05; **p<0.01; ***p<0.001.
Figure 3.
GEPIA of OVOLs in BRCA patients at different tumor stages. (A) OVOL1, (B) OVOL1, and (C) OVOL3.
Figure 4.
ROC curve showed the efficiency of OVOLs expression level in distinguishing BRCA tissue from nontumor tissues. (A) OVOL1, (B) OVOL2, and (C) OVOL3 were analyzed in this study.
Relationship Between OVOLs Expression and Survival in BRCA Patients
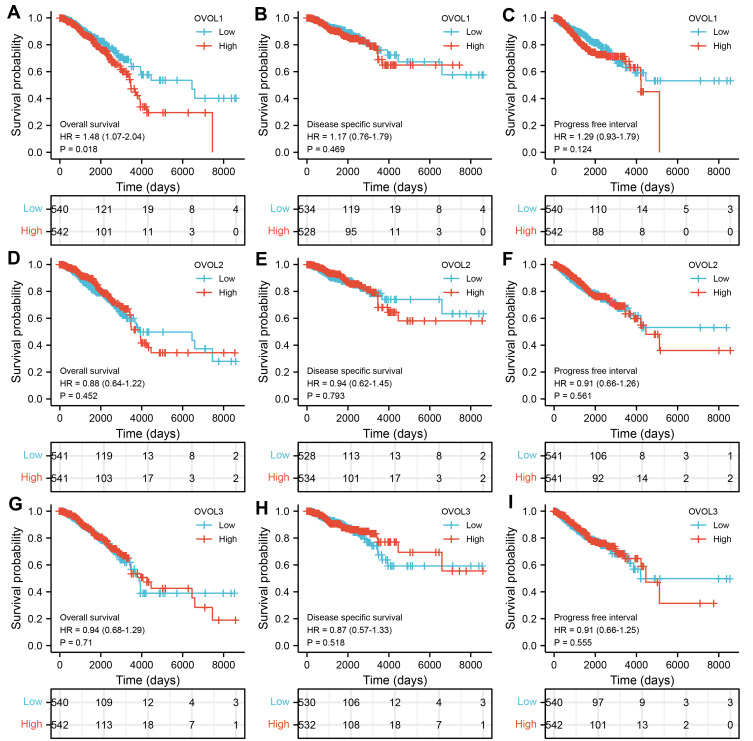
As shown in Figure 5, the OS of the OVOL1 mRNA high expression group was shorter than that of the OVOL1 low expression group at all time points (HR: 1.48; 95% CI: 1.07–2.04; P=0.018). It suggested that OVOL1 was a risk factor of BRCA. The mRNA of OVOL1 can be used as an indicator for predicting OS progression in BRCA.
Figure 5.
The expression of OVOLs is associated with poor OS in patients with BRCA. Overall survival in BRCA for (A) OVOL1, (D) OVOL2, and (G) OVOL3. Disease-specific survival in BRCA for (B) OVOL1, (E) OVOL2, and (H) OVOL3. Progress free survival in BRCA for (C) OVOL1, (F) OVOL2, and (I) OVOL3.
Variation and Correlation of OVOLs in BRCA Tissues
As shown in Figure 6A, nearly 5% had mutations in OVOLs, of which less than 1% had missense mutations, less than 1% had structural variants, less than 1% had profound deletions, and about 4% had amplifications, based on the 996 breast malignancy samples. More than 4.8% of patients had increased expression of OVOLs (Figure 6B). Some proteins were closely associated with OVOLs (Table S1). The results suggested that changes in the expression profile of OVOLs contributed to the development of BRCA.
Figure 6.
Gene expression and mutation analysis of OVOLs in BRCA (cBioPortal). (A) OVOLs gene mutation in BRCA; (B) detailed informed on the gene mutation of OVOLs.
GO and KEGG Analyses of OVOLs
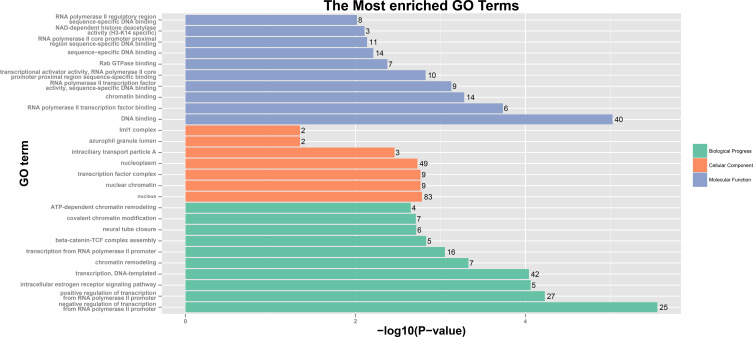
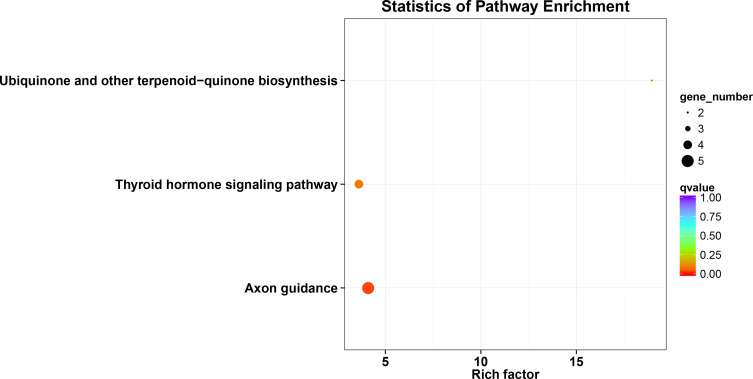
The results of analysis showed 25 enriched biological processes, mainly including negative regulation of transcription from RNA polymerase II promoter, positive regulation of transcription from RNA polymerase II promoter, intracellular estrogen receptor signaling pathway, transcription, DNA-templated, chromatin remodeling, transcription from RNA polymerase II promoter, beta-catenin-TCF complex assembly, neural tube closure, covalent chromatin modification, ATP-dependent chromatin remodeling and so on (Table S2 and Figure 7). The 9 enriched molecular functions included RNA polymerase II transcription factor binding, chromatin binding, RNA polymerase II transcription factor activity, sequence-specific DNA binding, transcriptional activator activity, RNA polymerase II core promoter proximal region sequence-specific binding, Rab GTPase binding, sequence-specific DNA binding, RNA polymerase II core promoter proximal region sequence-specific DNA binding, NAD-dependent histone deacetylase activity (H3-K14 specific), RNA polymerase II regulatory region sequence-specific DNA binding and so on (Table S2 and Figure 7). The results of analysis showed 7 cellular components, which were mainly related to nucleus, nuclear chromatin, transcription factor complex, nucleoplasm, intraciliary transport particle A, azurophil granule lumen, and Iml1 complex (Table S2 and Figure 7). The analysis of these functions provides further insight into the cellular localization, geometric distribution, and functional classes of the OVOLs. KEGG analysis showed that 3 pathways including axon guidance, thyroid hormone signaling pathway, and ubiquinone and other terpenoid-quinone biosynthesis in BRCA were associated with OVOLs (Table S2 and Figure 8). These results helped to understand the molecular mechanisms of OVOLs in the development of BRCA and provide some theoretical basis for clinical targeted therapy.
Figure 7.
GO analysis of OVOLs co-expression genes predicted by DAVID.
Figure 8.
KEGG analysis of OVOLs co-expression genes predicted by DAVID.
Discussion
This study used bioinformatics to investigate the relationship between OVOLs and the development and prognosis of BRCA. The results suggest that members of OVOLs could be used as new therapeutic targets and predictive markers for BRCA. OVOLs dysregulation has been reported in many cancers.
OVOL1 was a prognostic predictive marker for oral squamous cell carcinoma (OSCC).16 OVOL1 was significantly downregulated in cutaneous squamous cell carcinoma.24 OVOL1 expression was evident in eccrine poroma and hidradenoma.25 Low levels of OVOL2 were associated with low overall survival in patients with nasopharyngeal carcinoma (NPC), and could be used as a prognostic indicator for NPC patients.17 OVOL2 protein overexpression was associated with clinical grade (P=0.02) and the recurrence and metastasis (P=0.02) of osteosarcoma (OS).12 OVOL2 expression correlated with clinical staging of lung adenocarcinoma (LUAD).13 Overall survival was significantly lower in patients with hepatocellular carcinoma (HCC) with low OVOL2 expression.26 However, the relationship between OVOL3 and cancer is unclear. In this study, the mRNA expression levels of OVOL1/2 in BRCA tissues were significantly higher than those in normal breast tissues. OVOL3 was correlated with the clinical stage of BRCA. ROC analysis results suggested that OVOL1/2/3 could be served as ideal biomarkers to distinguish BRCA from nontumor tissue. The OVOL1 high expression was associated with OS shortening.
Overexpression of OVOL1 promoted OSCC progression by inhibiting ZEB1.16 OVOL1 was an upstream inhibitor of c-Myc and OVOL2, and the OVOL1-OVOL2 axis is a regulator of c-Myc that coordinately regulates the aggressiveness of cutaneous squamous cell carcinoma.24 Transcription factors OVOL1 and OVOL2 induce Epithelial-to-Mesenchymal Transition (EMT) in human cancers.11 PARP1-induced PARylation was a key event in OVOL2-mediated regulation of chromosome integrity and inhibition of cancer cell growth.27 OVOL2 expression was associated with MET in OS cells and inhibited ZEB1 expression and OS progression.12 OVOL2 played a key role in inhibiting NPC metastasis and maintaining the epithelial phenotype.14 OVOL2 inhibited the migratory and invasive capacity of A549 cells and directly prevents EMT by inhibiting Twist1 transcription.13 OVOL2 antagonized TGF-β signaling in the regulation of EMT during BRCA metastasis.28 OVOL2 was a colorectal cancer (CRC) suppressor that blocks WNT signaling by promoting the recruitment of histone deacetylase 1 to the TCF4-β-catenin complex.29 Elevated OVOL2 expression may inhibit HCC cell invasion and metastasis by limiting EMT.26 OVOL1 and OVOL2 regulate the stemness of cancer cells and thus play an important role in cancer cell metastasis.15 In this study, KEGG analysis showed that OVOLs were related to pathways including axon guidance, thyroid hormone signaling pathway, and ubiquinone and other terpenoid-quinone biosynthesis in BRCA.
BRCA is a heterogeneous disease exhibiting considerable variability in its prognostic pattern and response to treatment.30 To improve the robustness of the classification performance and stability of the detected biomarkers, discriminative gene subnetworks called network biomarkers are generated by aggregating functionally relevant genes, thus taking into account the existing knowledge about the relationships between genes in the classifier.31 The role of OVOLs in different subtypes of BRCA needs further study.
Conclusion
In conclusion, the expression and prognostic value of OVOLs in BRCA was analyzed in this study. The results suggested that OVOL1/2 was a potential target for the treatment of BRCA and that OVOL1 was a novel marker of BRCA prognosis. Further studies are needed to validate these results.
Acknowledgment
The authors thank TCGA for providing the data.
Funding Statement
This work was supported by International Science and Technology Cooperation Project of Guangzhou Development Zone (2017GH12), and Pearl River S&T Nova Program of Guangzhou (201806010020 and 201906010020).
Data Sharing Statement
The datasets generated and analyzed during the present study are available from the corresponding author on reasonable request.
Author Contributions
All authors made a significant contribution to the work reported, whether that is in the conception, study design, execution, acquisition of data, analysis, and interpretation, or in all these areas; took part in drafting, revising or critically reviewing the article; gave final approval of the version to be published; have agreed on the journal to which the article has been submitted; and agree to be accountable for all aspects of the work.
Disclosure
The authors declared that they have no conflicts of interest.
References
- 1.Bray F, Ferlay J, Soerjomataram I, Siegel RL, Torre LA, Jemal A. Global cancer statistics 2018: GLOBOCAN estimates of incidence and mortality worldwide for 36 cancers in 185 countries. CA Cancer J Clin. 2018;68(6):394–424. [DOI] [PubMed] [Google Scholar]
- 2.Siegel RL, Miller KD, Jemal A. Cancer statistics, 2019. CA Cancer J Clin. 2019;69(1):7–34. [DOI] [PubMed] [Google Scholar]
- 3.Wang Q, Zhao S, Gan L, Zhuang Z. Bioinformatics analysis of prognostic value of PITX1 gene in breast cancer. Biosci Rep. 2020;40(9):BSR20202537. doi: 10.1042/BSR20202537 [DOI] [PMC free article] [PubMed] [Google Scholar]
- 4.Duffy MJ, Walsh S, McDermott EW, Crown J. Biomarkers in breast cancer: where are we and where are we going? Adv Clin Chem. 2015;71:1–23. [DOI] [PubMed] [Google Scholar]
- 5.Perou CM, Sørlie T, Eisen MB, et al. Molecular portraits of human breast tumours. Nature. 2000;406(6797):747–752. doi: 10.1038/35021093 [DOI] [PubMed] [Google Scholar]
- 6.Slamon DJ, Leyland-Jones B, Shak S, et al. Use of chemotherapy plus a monoclonal antibody against HER2 for metastatic breast cancer that overexpresses HER2. N Engl J Med. 2001;344(11):783–792. doi: 10.1056/NEJM200103153441101 [DOI] [PubMed] [Google Scholar]
- 7.Tsuji G, Ito T, Chiba T, et al. The role of the OVOL1-OVOL2 axis in normal and diseased human skin. J Dermatol Sci. 2018;90(3):227–231. doi: 10.1016/j.jdermsci.2018.02.005 [DOI] [PubMed] [Google Scholar]
- 8.Kumar A, Bhandari A, Sinha R, et al. Molecular phylogeny of OVOL genes illustrates a conserved C2H2 zinc finger domain coupled by hypervariable unstructured regions. PLoS One. 2012;7(6):e39399–e39399. doi: 10.1371/journal.pone.0039399 [DOI] [PMC free article] [PubMed] [Google Scholar]
- 9.Nieto MA. The ins and outs of the epithelial to mesenchymal transition in health and disease. Annu Rev Cell Dev Biol. 2011;27:347–376. doi: 10.1146/annurev-cellbio-092910-154036 [DOI] [PubMed] [Google Scholar]
- 10.Li S, Yang J. Ovol proteins: guardians against EMT during epithelial differentiation. Dev Cell. 2014;29(1):1–2. doi: 10.1016/j.devcel.2014.04.002 [DOI] [PMC free article] [PubMed] [Google Scholar]
- 11.Roca H, Hernandez J, Weidner S, et al. Transcription factors OVOL1 and OVOL2 induce the mesenchymal to epithelial transition in human cancer. PLoS One. 2013;8(10):e76773. doi: 10.1371/journal.pone.0076773 [DOI] [PMC free article] [PubMed] [Google Scholar]
- 12.Liu J, Wu Q, Wang Y, et al. Ovol2 induces mesenchymal-epithelial transition via targeting ZEB1 in osteosarcoma. Onco Targets Ther. 2018;11:2963–2973. doi: 10.2147/OTT.S157119 [DOI] [PMC free article] [PubMed] [Google Scholar]
- 13.Wang ZH, Li Z, Hu M, et al. Ovol2 gene inhibits the epithelial-to-mesenchymal transition in lung adenocarcinoma by transcriptionally repressing Twist1. Gene. 2017;600:1–8. doi: 10.1016/j.gene.2016.11.034 [DOI] [PubMed] [Google Scholar]
- 14.Song KA, Faber AC. OVOL2 in metastasis prevention in NPC. Theranostics. 2018;8(8):2242–2244. doi: 10.7150/thno.25181 [DOI] [PMC free article] [PubMed] [Google Scholar]
- 15.Saxena K, Srikrishnan S, Celia-Terrassa T, Jolly MK. OVOL1/2: drivers of epithelial differentiation in development, disease, and reprogramming. Cells Tissues Organs. 2020;1–10. doi: 10.1159/000511383 [DOI] [PubMed] [Google Scholar]
- 16.Xu C, Yan T, Yang J. OVOL1 inhibits oral squamous cell carcinoma growth and metastasis by suppressing zinc finger E-box binding homeobox 1. Int J Clin Exp Pathol. 2019;12(7):2801–2808. [PMC free article] [PubMed] [Google Scholar]
- 17.Qi XK, Han HQ, Zhang HJ, et al. OVOL2 links stemness and metastasis via fine-tuning epithelial-mesenchymal transition in nasopharyngeal carcinoma. Theranostics. 2018;8(8):2202–2216. doi: 10.7150/thno.24003 [DOI] [PMC free article] [PubMed] [Google Scholar]
- 18.Sun CC, Li SJ, Hu W, et al. Comprehensive analysis of the expression and prognosis for E2FS in human breast cancer. Mol Ther. 2019;27(6):1153–1165. doi: 10.1016/j.ymthe.2019.03.019 [DOI] [PMC free article] [PubMed] [Google Scholar] [Retracted]
- 19.Tang Z, Li C, Kang B, Gao G, Li C, Zhang Z. GEPIA: a web server for cancer and normal gene expression profiling and interactive analyses. Nucleic Acids Res. 2017;45(W1):W98–w102. doi: 10.1093/nar/gkx247 [DOI] [PMC free article] [PubMed] [Google Scholar]
- 20.Vivian J, Rao AA, Nothaft FA, et al. Toil enables reproducible, open source, big biomedical data analyses. Nat Biotechnol. 2017;35(4):314–316. doi: 10.1038/nbt.3772 [DOI] [PMC free article] [PubMed] [Google Scholar]
- 21.Liu J, Lichtenberg T, Hoadley KA, et al. An integrated TCGA pan-cancer clinical data resource to drive high-quality survival outcome analytics. Cell. 2018;173(2):400–416.e411. [DOI] [PMC free article] [PubMed] [Google Scholar]
- 22.Huang da W, Sherman BT, Lempicki RA. Systematic and integrative analysis of large gene lists using DAVID bioinformatics resources. Nat Protoc. 2009;4(1):44–57. doi: 10.1038/nprot.2008.211 [DOI] [PubMed] [Google Scholar]
- 23.Curtis C, Shah SP, Chin SF, et al. The genomic and transcriptomic architecture of 2000 breast tumours reveals novel subgroups. Nature. 2012;486(7403):346–352. doi: 10.1038/nature10983 [DOI] [PMC free article] [PubMed] [Google Scholar]
- 24.Ito T, Tsuji G, Ohno F, Nakahara T, Uchi H, Furue M. Potential role of the OVOL1-OVOL2 axis and c-Myc in the progression of cutaneous squamous cell carcinoma. Mod Pathol. 2017;30(7):919–927. doi: 10.1038/modpathol.2016.169 [DOI] [PubMed] [Google Scholar]
- 25.Mitoma C, Nakahara T, Uchi H, et al. Preferential expression of OVOL1 in inner root sheath of hair, sebaceous gland, eccrine duct and their neoplasms in human skin. Fukuoka Igaku Zasshi. 2014;105(8):166–173. [PubMed] [Google Scholar]
- 26.Fu H, Qi L, Chen L, He Y, Zhang N, Guo H. Expression of Ovol2 is related to epithelial characteristics and shows a favorable clinical outcome in hepatocellular carcinoma. Onco Targets Ther. 2016;9:5963–5973. doi: 10.2147/OTT.S110409 [DOI] [PMC free article] [PubMed] [Google Scholar]
- 27.Zhang R, Hong JJ, Yang Q, Ong CT, Li BA, Liou YC. Poly(ADP-ribosyl)ation of OVOL2 regulates aneuploidy and cell death in cancer cells. Oncogene. 2019;38(15):2750–2766. doi: 10.1038/s41388-018-0615-3 [DOI] [PubMed] [Google Scholar]
- 28.Wu RS, Hong JJ, Wu JF, et al. OVOL2 antagonizes TGF-β signaling to regulate epithelial to mesenchymal transition during mammary tumor metastasis. Oncotarget. 2017;8(24):39401–39416. doi: 10.18632/oncotarget.17031 [DOI] [PMC free article] [PubMed] [Google Scholar]
- 29.Ye GD, Sun GB, Jiao P, et al. OVOL2, an inhibitor of WNT signaling, reduces invasive activities of human and mouse cancer cells and is down-regulated in human colorectal tumors. Gastroenterology. 2016;150(3):659–671.e616. doi: 10.1053/j.gastro.2015.11.041 [DOI] [PubMed] [Google Scholar]
- 30.Prat A, Parker JS, Fan C, Perou CM. PAM50 assay and the three-gene model for identifying the major and clinically relevant molecular subtypes of breast cancer. Breast Cancer Res Treat. 2012;135(1):301–306. doi: 10.1007/s10549-012-2143-0 [DOI] [PMC free article] [PubMed] [Google Scholar]
- 31.Jubair S, Alkhateeb A, Tabl AA, Rueda L, Ngom A. A novel approach to identify subtype-specific network biomarkers of breast cancer survivability. Netw Model Anal Health Inform Bioinform. 2020;9(1):43. doi: 10.1007/s13721-020-00249-4 [DOI] [Google Scholar]


