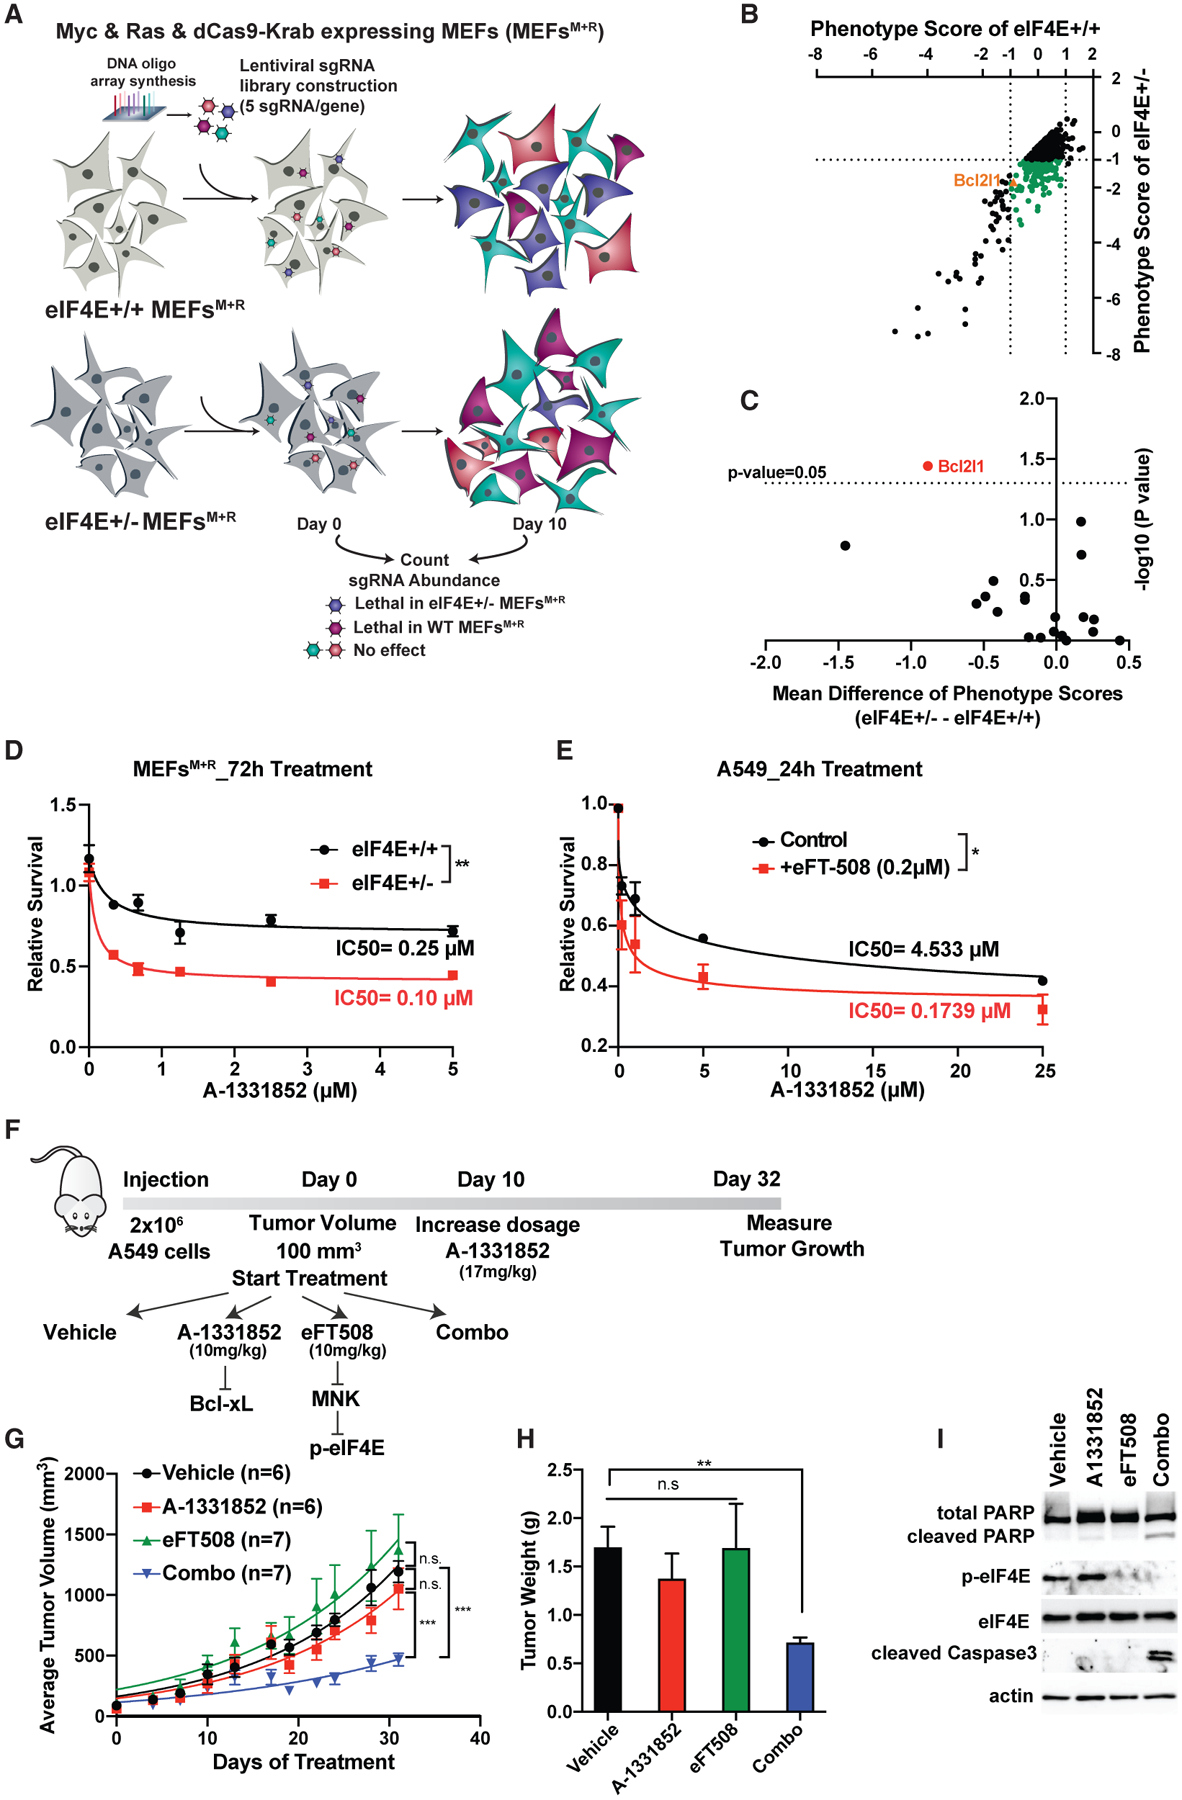
Figure 1. Genome-wide CRISPRi screen reveals anti-apoptotic protein Bcl-xL as synthetic lethal partner of eIF4E.

(A) Schematic representation of genome-wide CRISPRi screen in MEFs expressing Myc and Ras. Two independent screens were performed for each condition.
(B) Synthetic lethal partners of eIF4E. Phenotype scores of each gene are calculated based on the mean value of the activity of five sgRNAs on day 10 versus day 0. The green dots represent genes that promote specific lethality in eIF4E+/− cells (|log2[eIF4E+/+]| < 1 and log2[eIF4E+/−] < 1).
(C) Identification of Bcl2l1 as the only Bcl2 family gene that significantly promotes lethality in eIF4E+/− cells. The mean difference is calculated by subtracting the phenotype scores of each gene in eIF4E+/− − eIF4E+/+ cells. For each gene, the p value was calculated using a paired Wilcoxon test.
(D) Treatment of MEFs expressing Myc and Ras with different concentrations of the Bcl-xL inhibitor A-1331852 for 72 h. A CellTiter Glo assay was performed and relative survival for each genotype was plotted normalized to cells treated with DMSO (n > 3).
(E) Treatment of A549 lung cancer cells with A-1331852 together with eIF4E inhibitor eFT508 (0.2 μM) for 24 h. A two-way ANOVA test was performed to determine statistical significance (n = 3).
(F) Schematic representation of in vivo injection of A549 cells into NSG mice.
(G) Measurement of tumor volumes over 32 days of treatment. “n” represents number of mice used in each group. A one-way ANOVA with covariates followed by a false discovery rate (FDR) adjustment was performed.
(H) Measurement of tumor weight on day 32. A Kruskal-Wallis test and then a Wilcoxon rank-sum test were performed followed by FDR adjustment.
(I) Western blot analysis of representative tumor samples collected on day 32.
All values represent the mean + SEM. *p < 0.01, **p < 0.001, ***p < 0.0001. See also Figures S1 and S2.
