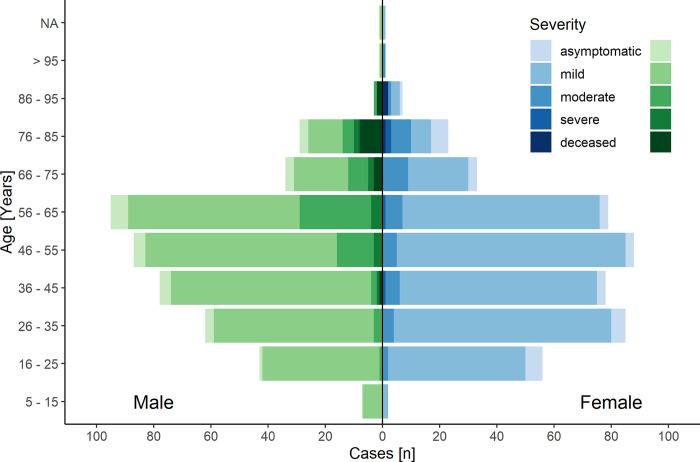
Fig 2. Severity and age distribution.
Patients with COVID-19 stratified by age and sex. Female n = 453; Male n = 441 The left-hand side (green) shows male and the right-hand side (blue) female participants. The shades of color represent different level of disease severity. The severity of disease increases with darker shades of color. Further details on the group´s composition can be found in Tables 1 and 2.

