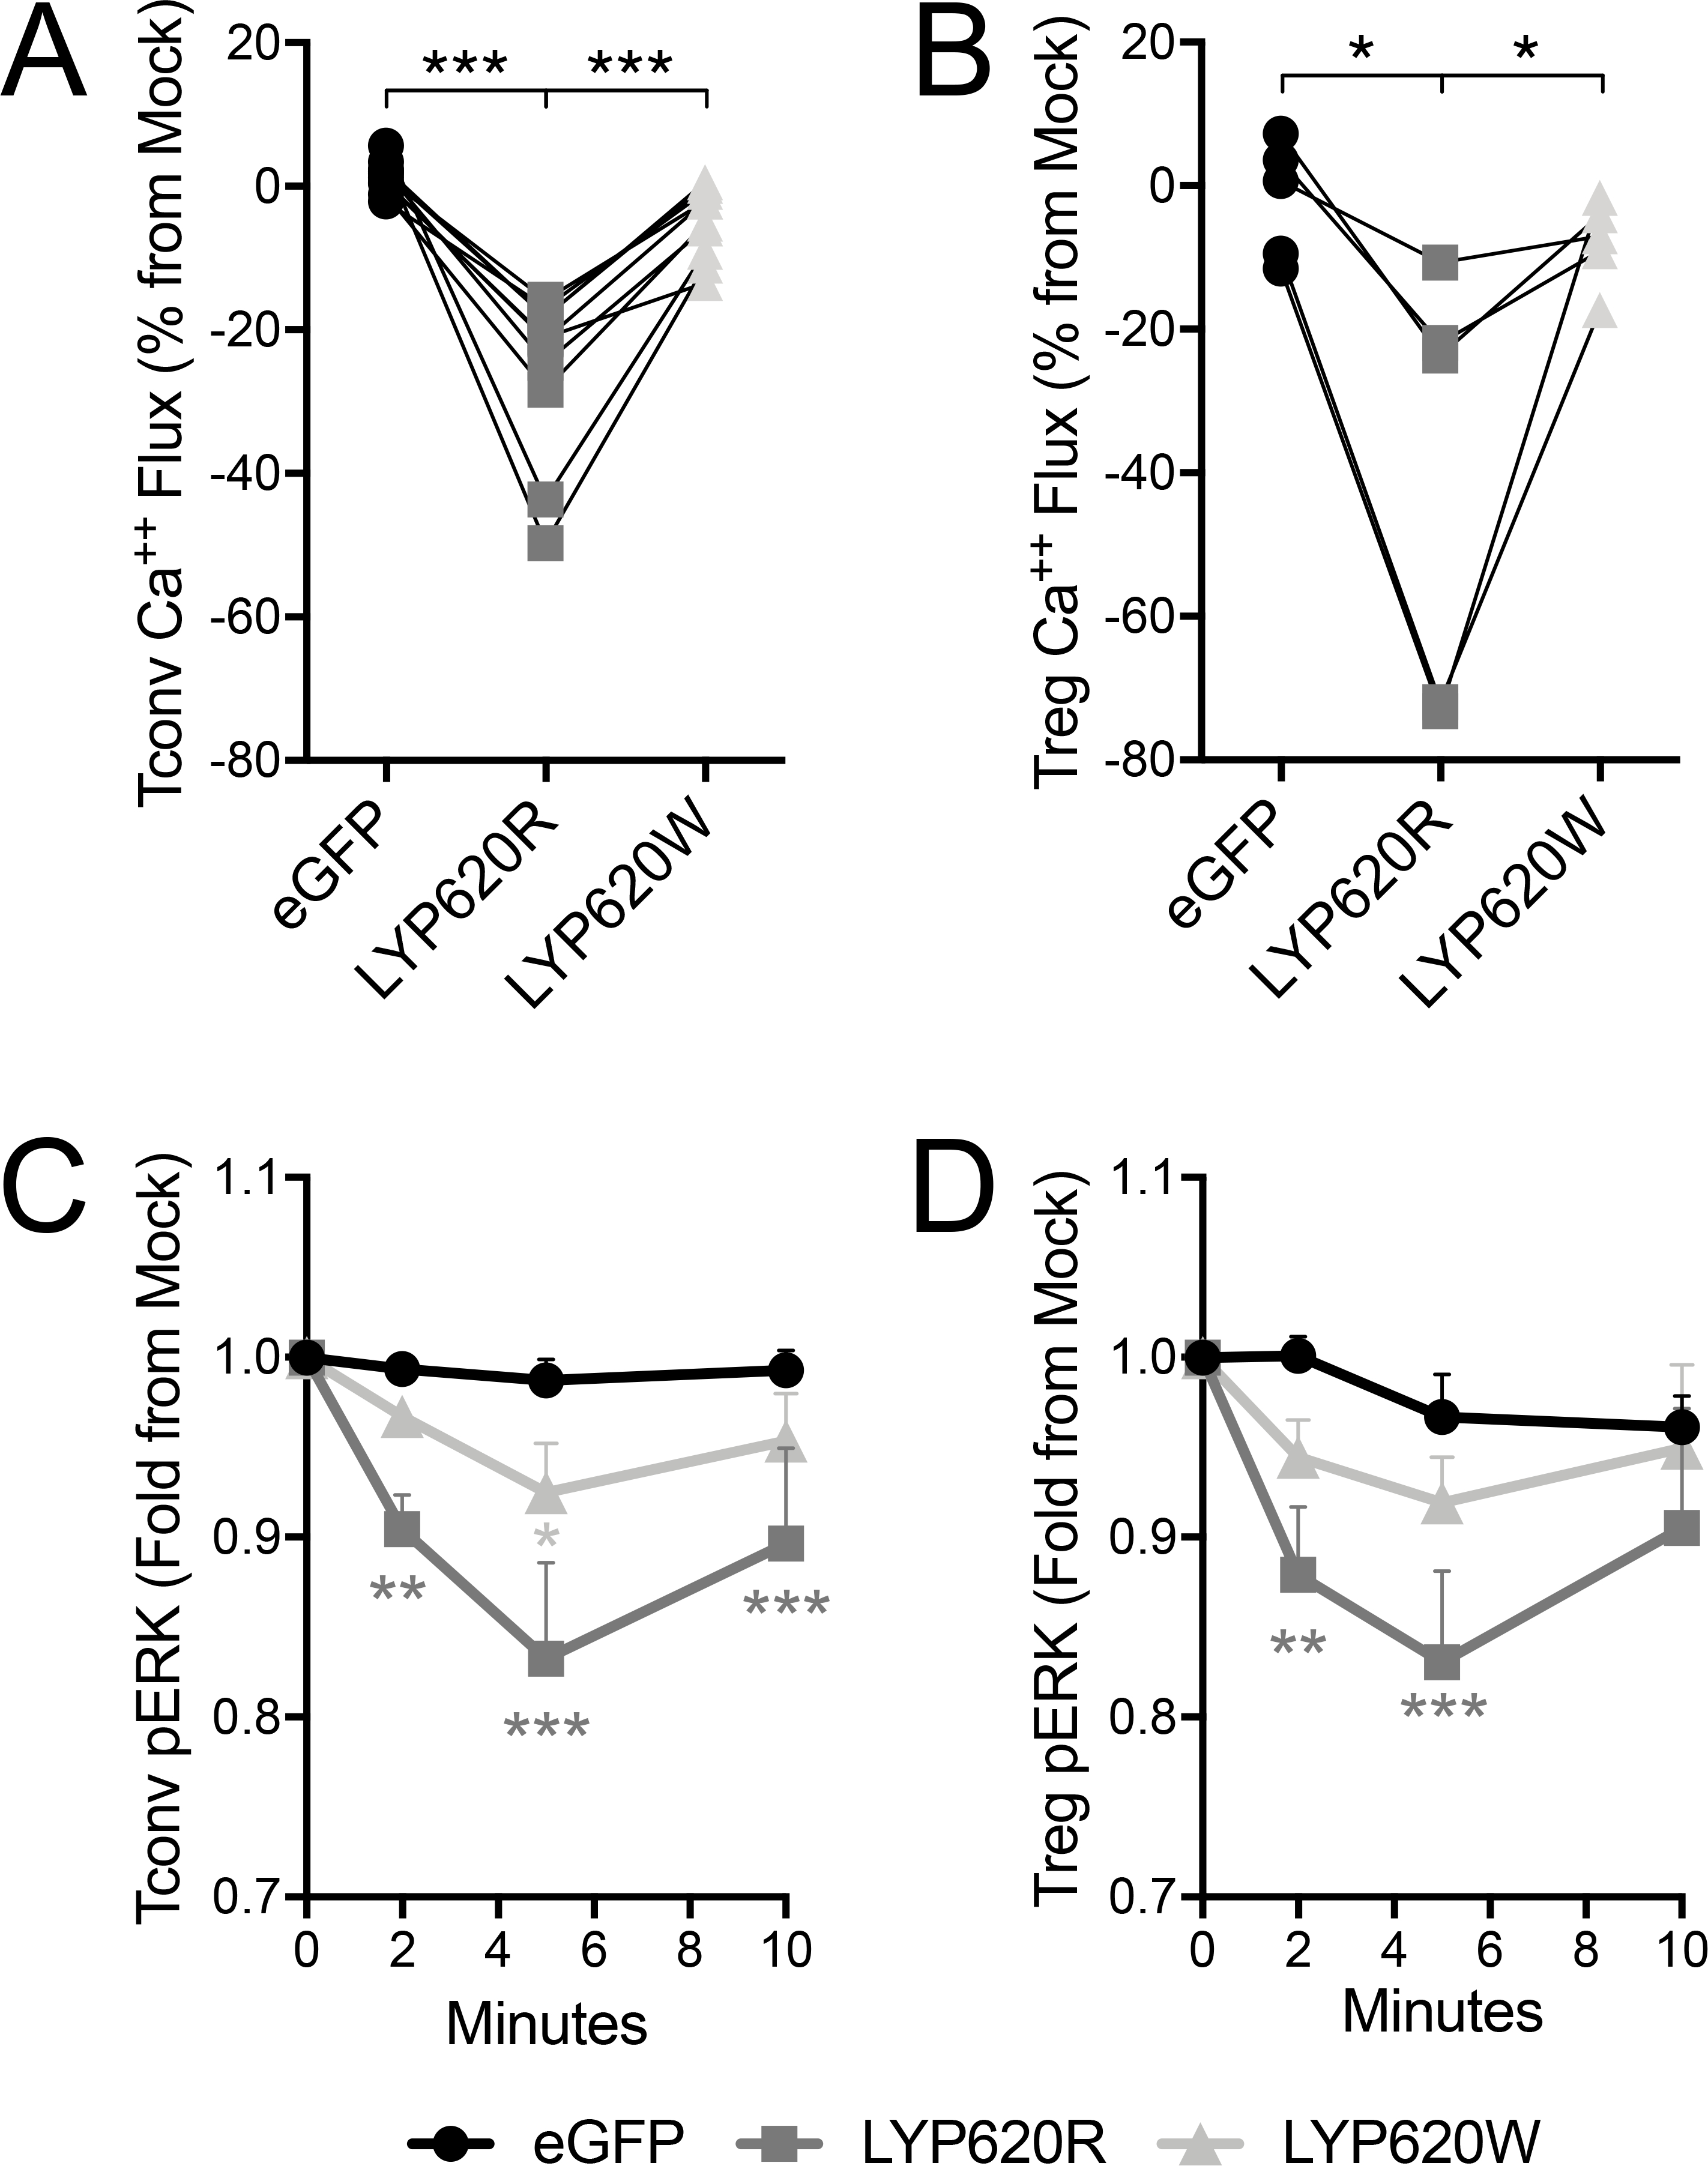
Figure 2. The risk variant of PTPN22 has a weaker impact on distal TCR signaling than the non-risk variant.

Primary human CD4 Tconv and Treg were transfected to express LYP-620R, LYP-620W risk variant, or eGFP as a control. Calcium flux by (A) Tconv and (B) Treg in response to soluble anti-CD3 and cross-linker was assessed by ratiometric fluorescent dye. The area under the curve during TCR activation was quantified (see Supplemental Figure 3) and then normalized to internal mock control cells (eGFP-). Individual donors are shown with lines connecting their matched T cell transductants (Tconv donors n=10, Treg donors n=5, One-way ANOVA using subject matching with Bonferroni’s posttest). Phospho-ERK (pERK) signaling by Tconv (C) and Treg (D) in response to soluble anti-CD3 and cross-linker was assessed by intracellular phospho-ERK staining. The mean fluorescence intensity (MFI) for each time point was quantified and then normalized to internal mock control cells (eGFP-). Normalized pERK means±SEM are shown with lines connecting the T cell transductant group over the timecourse (Tconv donors n=8, Treg donors n=5, Two-way ANOVA using subject and timepoint matching with Bonferroni’s posttest, *p<0.05, **p<0.01, ***p<0.001, shaded to indicate significance for that group versus eGFP).
