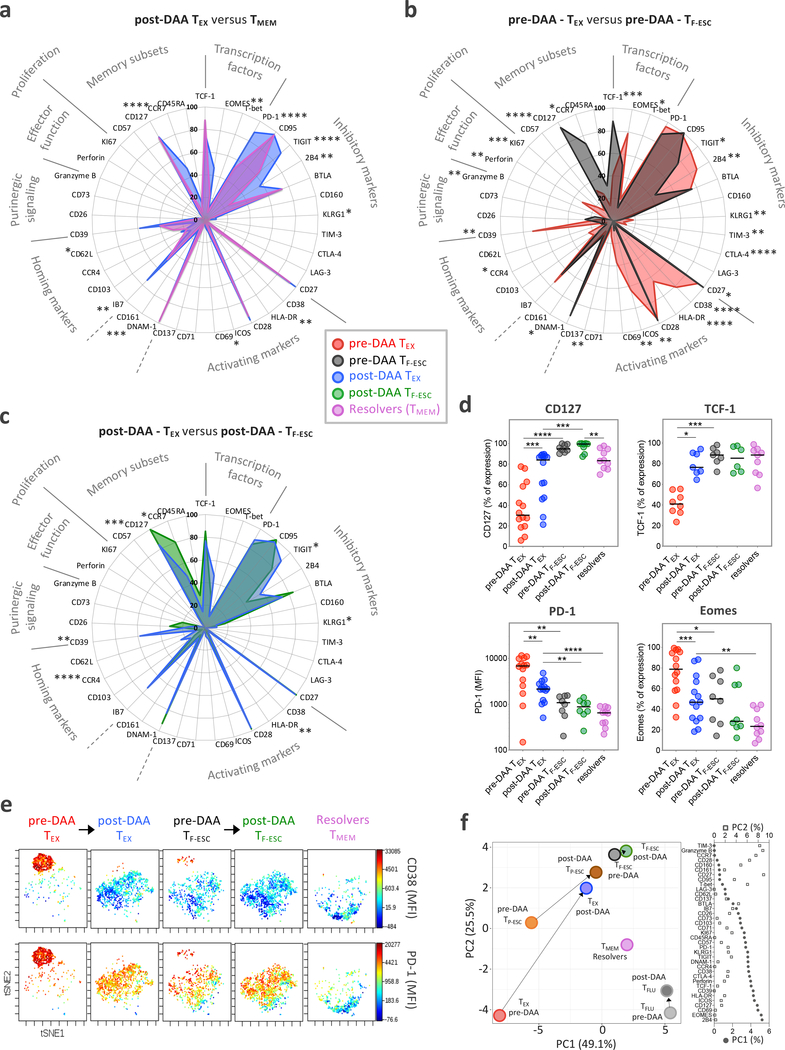
Figure 3: The phenotypic change of TEX towards TMEM after HCV cure remains incomplete.
a, Comparison of the phenotypic immune signature of post-DAA TEX (n=14) to that of TMEM from spontaneous HCV-resolvers (n=10). b, Comparison of the TEX phenotypic immune signature (n=14) to that of TF-ESC (n=8) pre-DAA therapy. c, Comparison of the TEX phenotypical immune-signature (n=14) to TF-ESC (n=8), post-DAA therapy. a-c, Data are expressed as the percentage of cells expressing the listed markers. Dot plot histograms comparing expression levels of the 37 proteins studied across the different HCV-specific CD8+ T cell populations are presented in Extended Data Fig. 3b. Statistical testing by Mann-Whitney tests (unpaired, nonparametric, two-sided). d, Dot plot histograms displaying CD127, TCF-1, PD-1 and Eomes expression levels across TEX and TF-ESC, pre- and post-DAA therapy, and in resolver TMEM. Statistical testing by Mann-Whitney tests when comparing TEX versus TF-ESC or TMEM (unpaired, nonparametric, two-sided), or by Wilcoxon tests (paired, nonparametric, two-sided) when comparing paired samples pre- versus post-DAA. A schematic representation of the comparison rules and statistical tests used is presented in Extended Data Fig. 3c. a-d, *P < 0.05, **P < 0.01, ***P < 0.001, ****P < 0.0001. e, t-SNE analysis of TEX and TF-ESC, pre- and post-DAA therapy, as well as resolver TMEM, based on the expression levels of CD38, HLA-DR, PD-1, CD39, TIGIT, CCR7, CD45RA, Integrin-Beta-7 and CD62L. Expression levels (MFI) of CD38 and PD-1 are displayed using a color scheme. f, Principal component analysis of the expression levels of the 37 proteins, as detected by flow cytometry, by TEX, TP-ESC, TF-ESC and TFLU, pre- and post-DAA therapy, as well as by resolver TMEM. Respective contributions of the 37 different proteins in driving PC1 and PC2 are depicted in the right panel.

