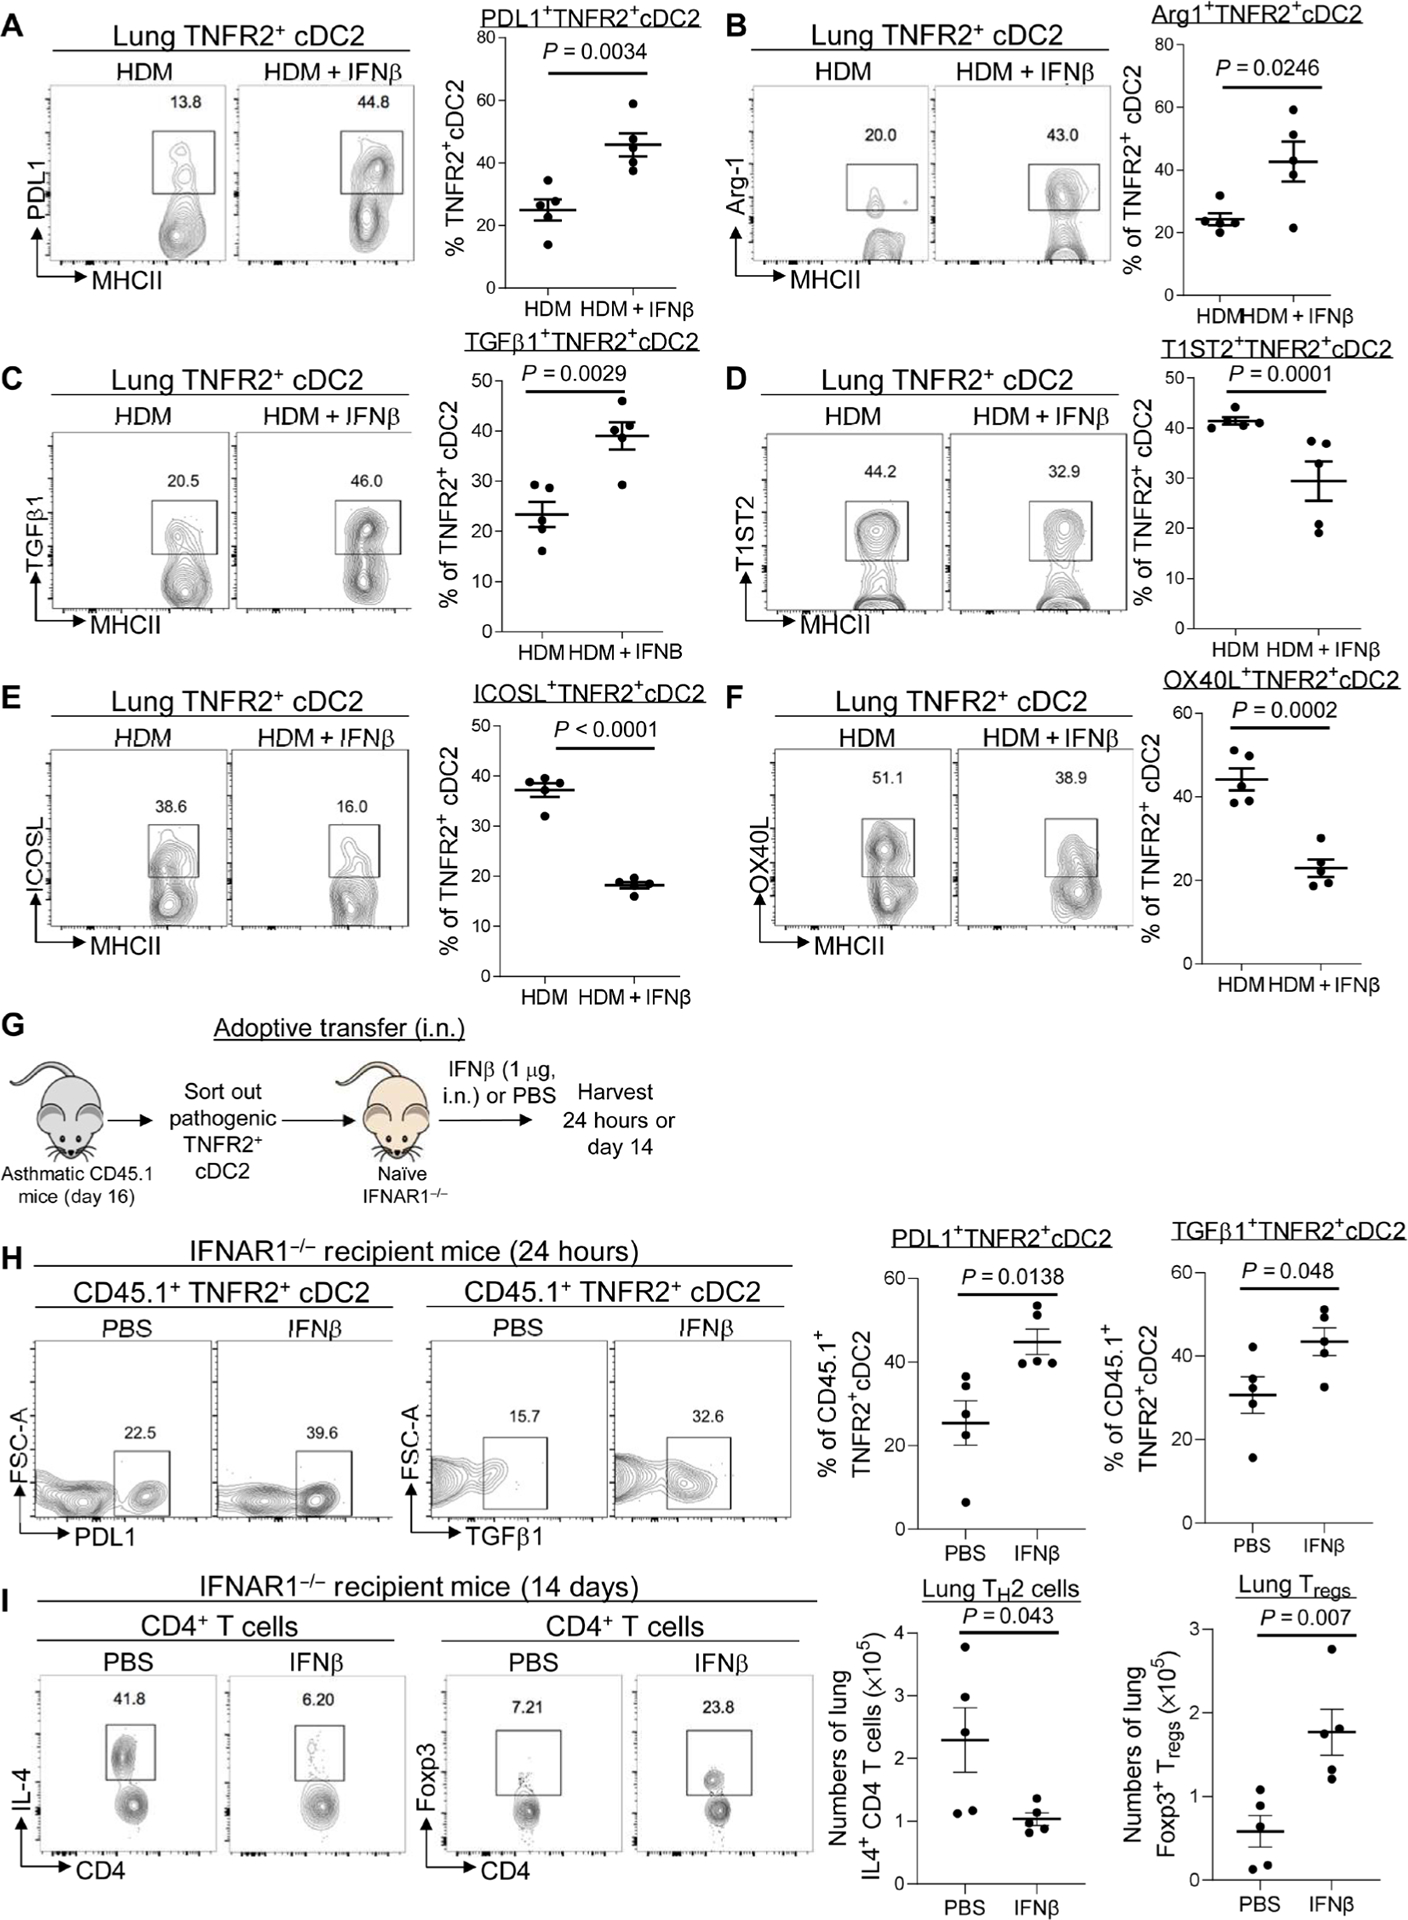
Fig. 4. IFNβ reprogrammed pathogenic TNFR2+ CDC2S in vivo to generate lung Tregs.

(A to C) Flow cytometry analysis and frequency of PD-L1, Arg-1, and TGFβ1 expression on TNFR2+ cDC2s in asthmatic mice treated with IFNβ (0.2 μg). Lung cDC2s are MHCIIhiCD11c+CD11b+CD64−CD24+ (n = 3 to 5 mice per group). Data are representative of two to three independent experiments. (D to F) Flow cytometry analysis and frequency of T1ST2, OX40L, and ICOSL expression on lung TNFR2+ cDC2s in asthmatic mice treated with IFNβ (0.2 μg) (n = 3 to 5 mice per group). Data are representative of two to three independent experiments. (G) Experimental design for adoptive transfer. Lung TNFR2+ cDC2s cells were sorted out of asthmatic CD45.1 mice on day 16. About 60,000 TNFR2+ cDC2s cells were transferred intranasally into IFNAR1−/− recipient mice. Recipient mice were treated with IFNβ (1 μg) or PBS. (H) Flow cytometry analysis and frequency of CD45.1+TNFR2+ cDC2s in the recipient mice after IFNβ treatment (n = 3 to 5 mice per group). Data are representative of two independent experiments. (I) Flow cytometry analysis and numbers of IL-4–producing CD4+ T cells (left) and Tregs (right) in recipient mice treated with IFNβ on day 14 after IFNβ treatment (n = 3 to 5 mice per group). Data are representative of two independent experiments. Graphs represent the mean, with error bars indicating SEM. P values were determined by unpaired Student’s t test.
