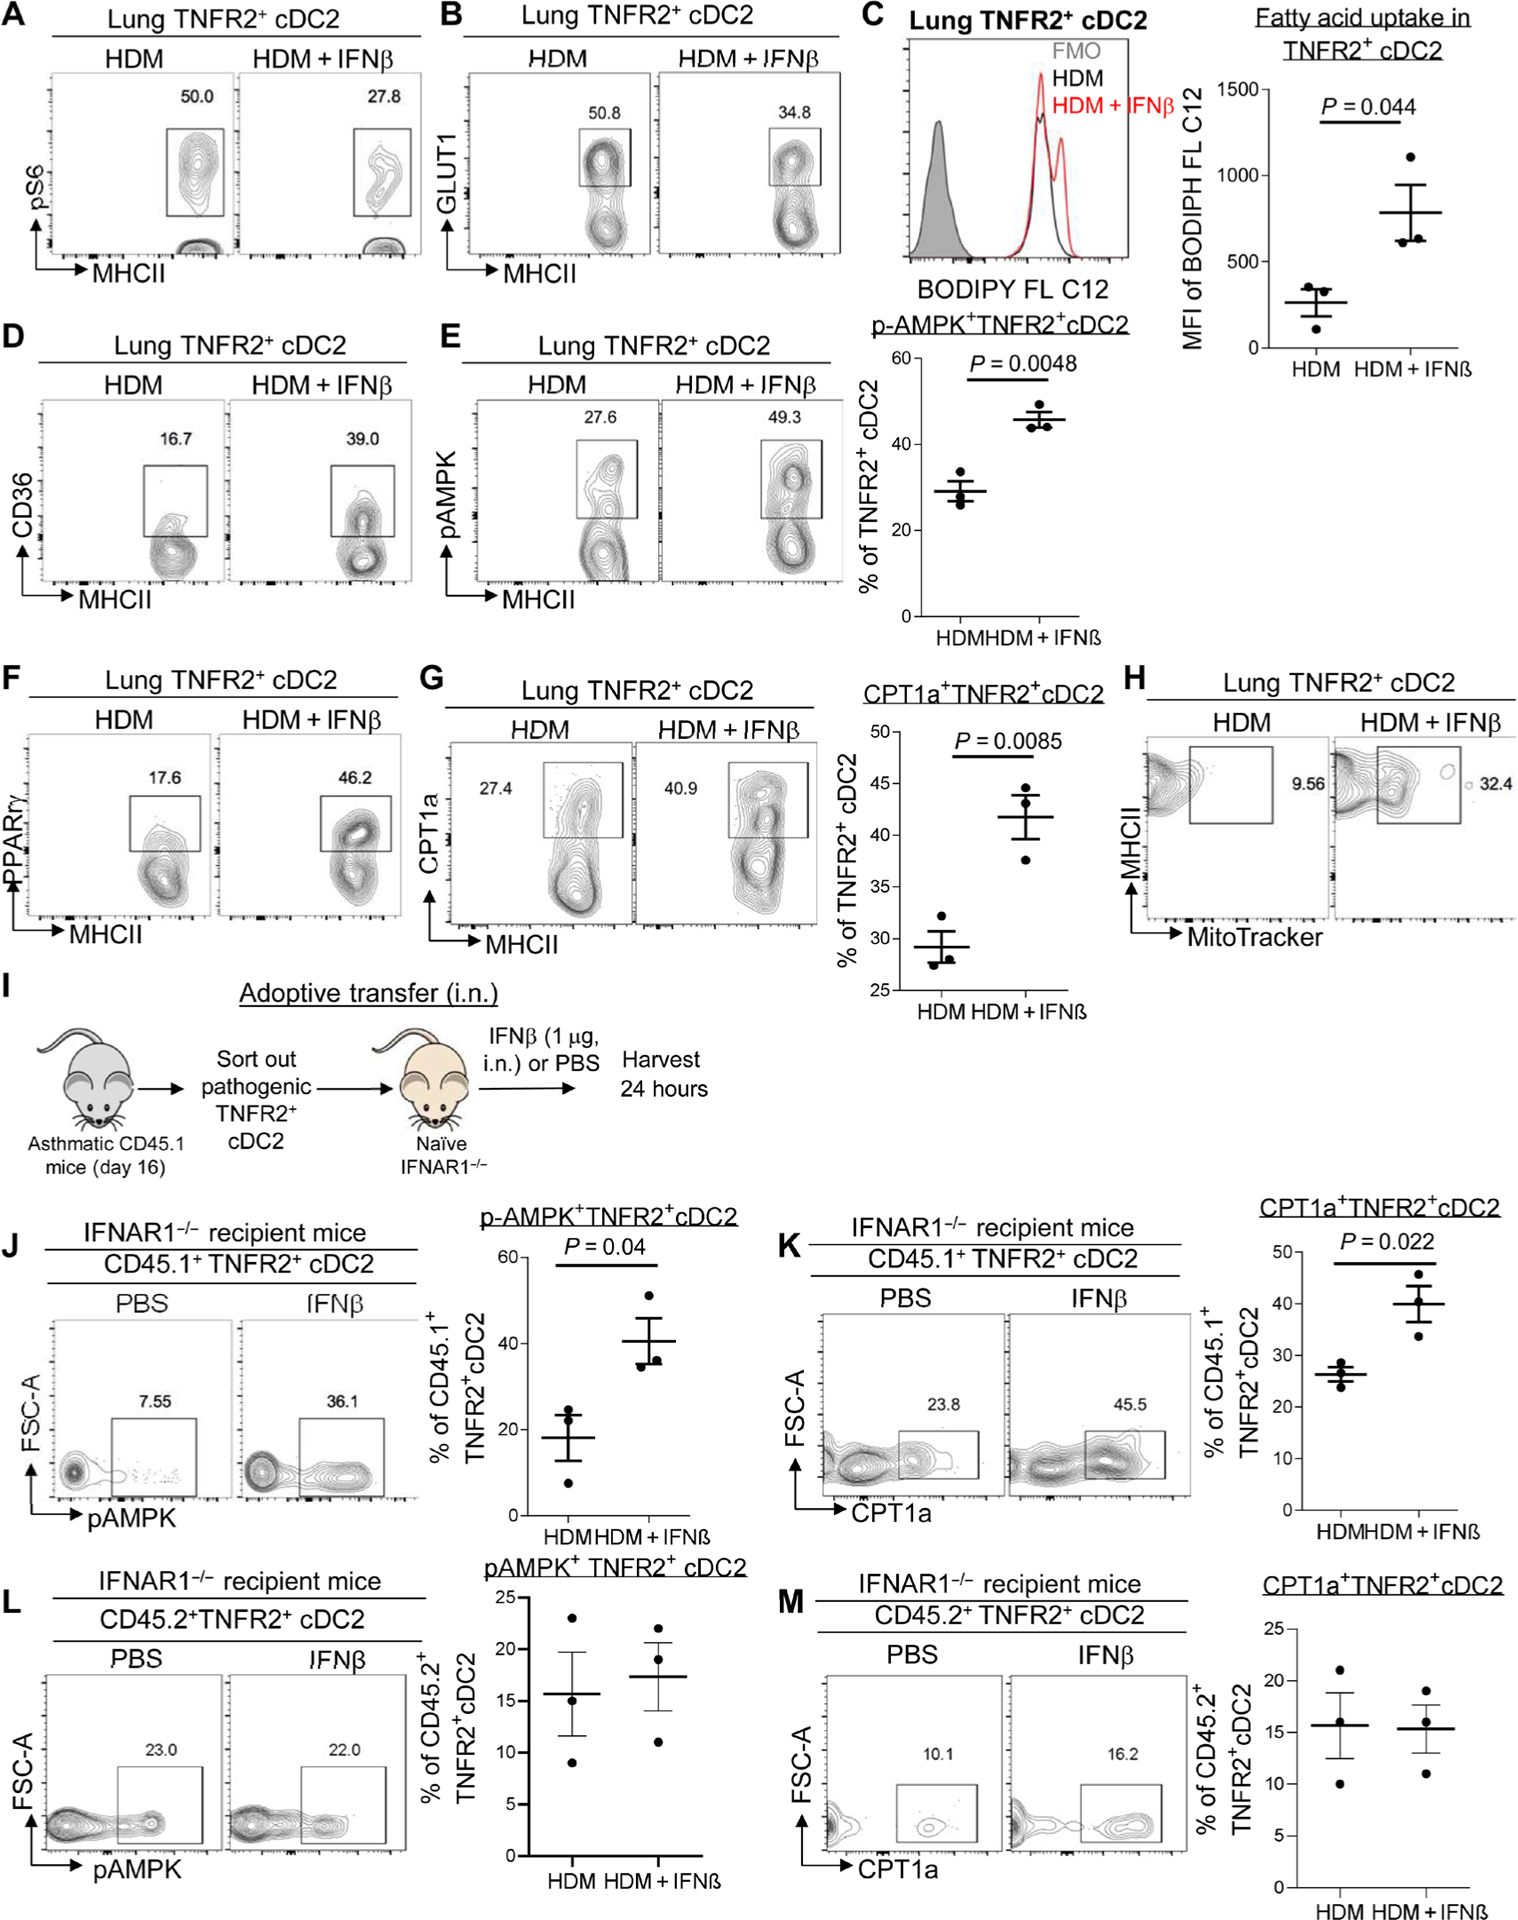
Fig. 5. IFNβ enhanced mitochondrial FAO in pathogenic lung TNFR2+ cDC2s.

(A and B) Flow cytometry analysis of pS6 and GLUT1 expression in TNFR2+ cDC2s of asthmatic mice treated with IFNβ as in Fig. 1 (n = 3 mice per group). Data are representative of three independent experiments. (C) Representative histogram (left) and quantitative results of the geometric mean fluorescence intensity (right) of BODIPY C12 in TNFR2+ cDC2s from (A). Data are representative of three independent experiments. (D to G) Flow cytometry analysis of CD36 (D), pAMPK (E), PPARγ (F), and CPT1a (G) expression in TNFR2+ cDC2s of C57BL/6J mice from (A). Data are representative of three independent experiments. (H) Flow cytometry analysis of MitoTracker Green in TNFR2+ cDC2s of the lung from C57BL/6J mice from (A). Data are representative of three independent experiments. (I) Experimental design for adoptive transfer. Lung TNFR2+ cDC2s cells were sorted out of asthmatic CD45.1 mice on day 16. About 60,000 TNFR2+ cDC2s cells were transferred intranasally into IFNAR1−/− recipient mice. Recipient mice were treated with IFNβ (1 μg) or PBS. (J and K) Flow cytometry analysis of pAMPK (J) and CPT1a (K) expression in CD45.1+TNFR2+cDC2s from the recipient mice after 24 hours (n = 3 mice per group). Data are representative of two independent experiments. (L and M) Flow cytometry analysis of pAMPK and CPT1a expression in CD45.2+ TNFR2+cDC2s from the recipient mice after 24 hours (n = 3 mice per group). Data are representative of two independent experiments. Graphs represent the mean, with error bars indicating SEM. P values were determined by unpaired Student’s t test. Rabbit mAb isotype control staining for pAMPK and pS6 can be found in fig. S6.
