
Fig. 11.
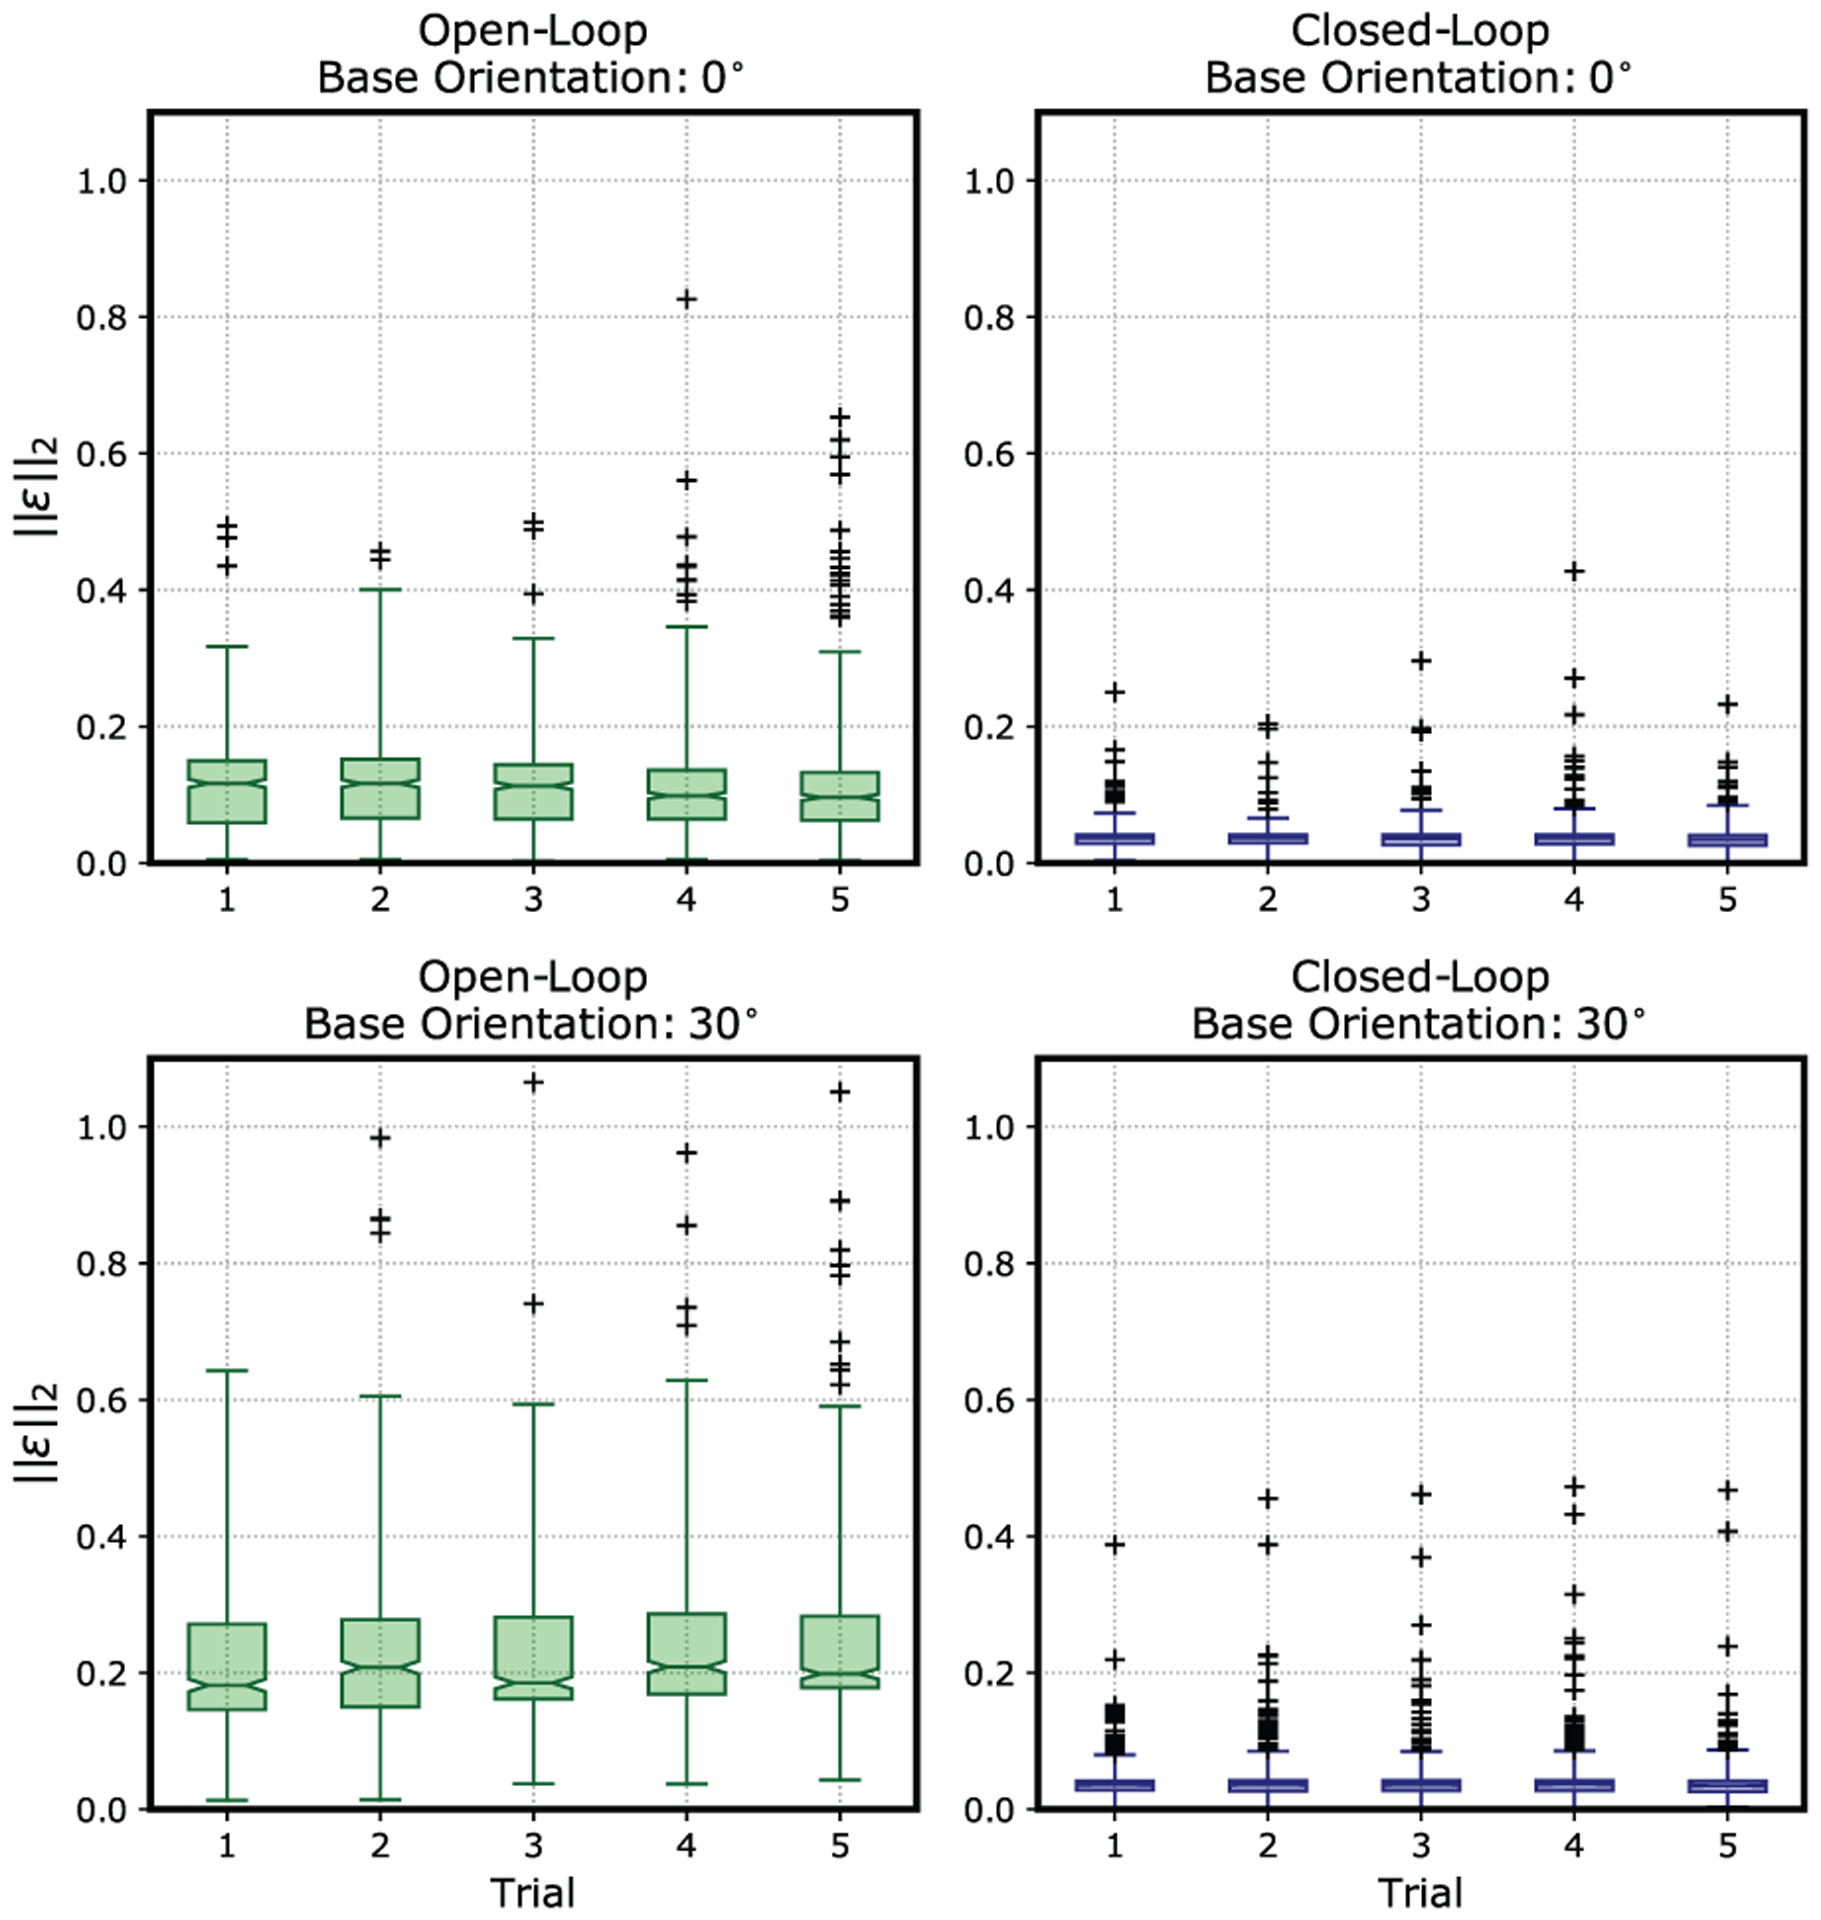
Box plot showing error distribution and variability over the five tests performed for each set of experiments for both closed loop and open loop, in the flat and pre-bent initial configuration.
Official websites use .gov
A
.gov website belongs to an official
government organization in the United States.
Secure .gov websites use HTTPS
A lock (
) or https:// means you've safely
connected to the .gov website. Share sensitive
information only on official, secure websites.
Box plot showing error distribution and variability over the five tests performed for each set of experiments for both closed loop and open loop, in the flat and pre-bent initial configuration.