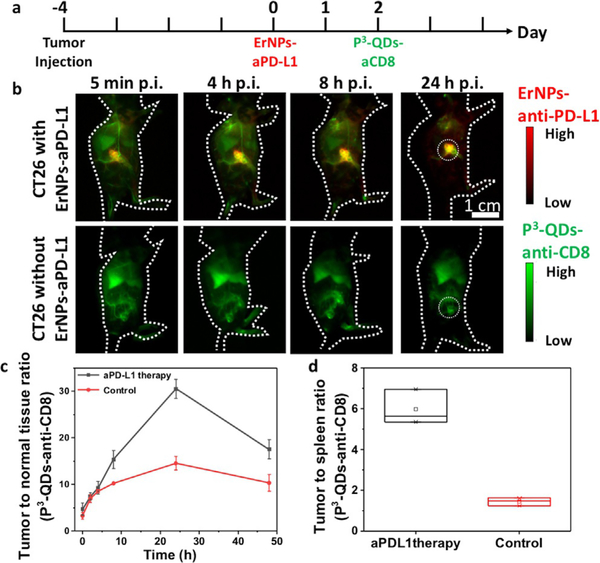
Figure 3.
P3-QDs-anti-CD8 diabody conjugate for in vivo molecular Imaging of CD8+ T cells. a) Treatment scheme. Balb/c mice were inoculated subcutaneously with CT26 tumors on the right side of the back. P3-ErNPs-anti-PD-L1 were injected intravenously when the tumor size reached 4 mm (typically 3–4 days after inoculation), and P3-QDs-anti-CD8 were injected 2 days after the injection of ErNPs-anti-PD-Ll. b) Wide-field NIR-IIb (1500–1700 nm) fluorescence images of mice with CT26 tumors injected with P3-QDs-anti-CD8, with and without ErNPs-anti-PD-L1 therapy (n = 3 for each group) at different time points after the injection of P3-QDs-anti-CD8. P3-QDs-anti-CD8 were excited by an 808-nm continuous-wave laser, and ErNPs-anti-PD-L1 were excited by a 975-nm pulse laser (duration = 14 ms). Fluorescence emission in the NIR-IIb window were collected for both channels. c) Tumor-to-normal-tissue ratio of P3-QDs-anti-CD8 channel over the course of 48 hours after the injection of P3-QDs-anti-CD8. d) Tumor-to-spleen ratio of the P3-QDs-anti-CD8 channel 24 hours after the administration of P3-QDs-anti-CD8.

