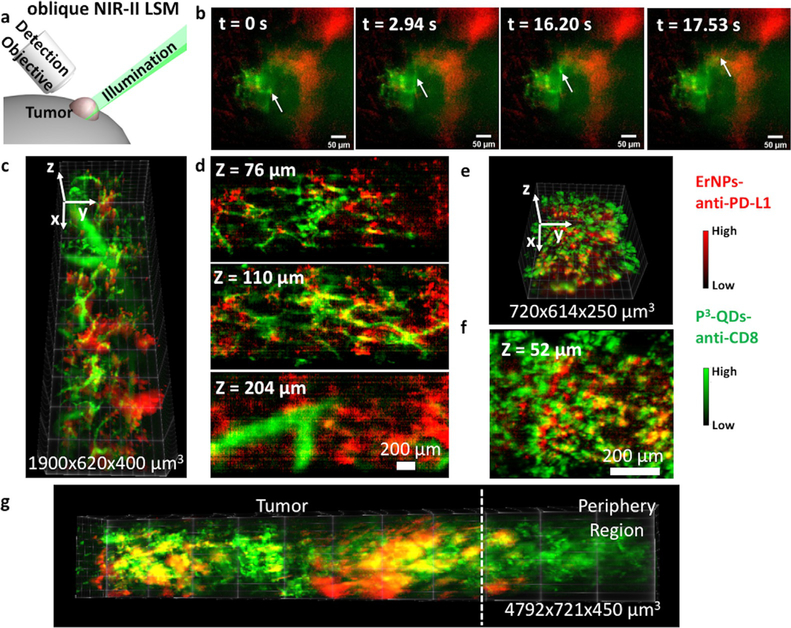
Figure 4.
In vivo two-plex LSM imaging of CT26 tumors. a) Scheme of in vivo NIR-II oblique LSM showing positions of the illumination light, the detection objective, and the tumor. b) Video-rate LSM imaging of a CT26 tumor at a fixed illumination plane 2 hours after the injection of P3-QDs-anti-CD8. The arrow showed the motion of CD8 + T cells in tumor microenvironment. Green color: P3-QDs-anti-CD8 channel, red color: ErNPs-anti-PD-L1 channel. Reconstructed 3D LSM image of a CT26 tumor obtained c) 6 hours or e) 24 hours after the injection of P3-QDs-anti-CD8. d,f) Corresponding two-plex xy images at different z positions. g) Reconstructed 3D LSM image of a CT26 tumor obtained 24 hours after the injection of P3-QDs-anti-CD8 showing tumor and the periphery region.

