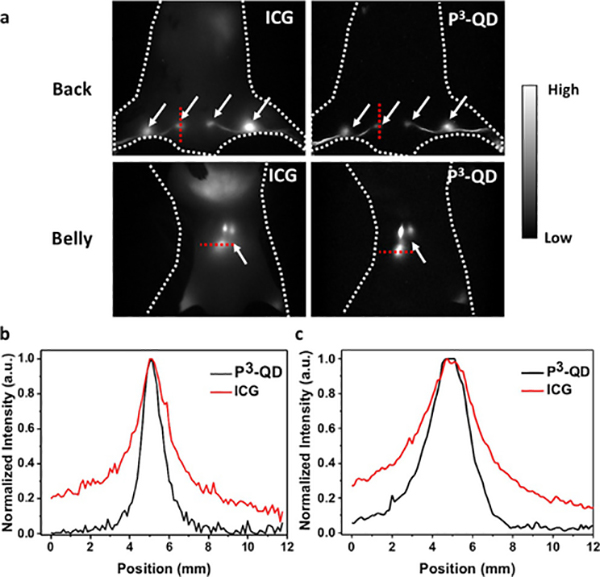
Figure 6.
Lymph node imaging with P3-QDs and ICG. a) Wide-field fluorescence images of a balb/c mouse co-injected with ICG (1100–1200 nm) and P3-QDs (1500–1700 nm) from the foot pads. The mice were excited with an 808-nm laser at a power density of 70 mWcm−2. White arrows indicate the positions of the lymph nodes (sacral, popliteal and lumbar lymph nodes are shown here). Fluorescence intensity cross-sectional profile of b) sacral and c) lumbar lymph nodes in NIR-II (1000−1200 nm)/NIR-IIb. Locations of the line profiles are shown in (a).

