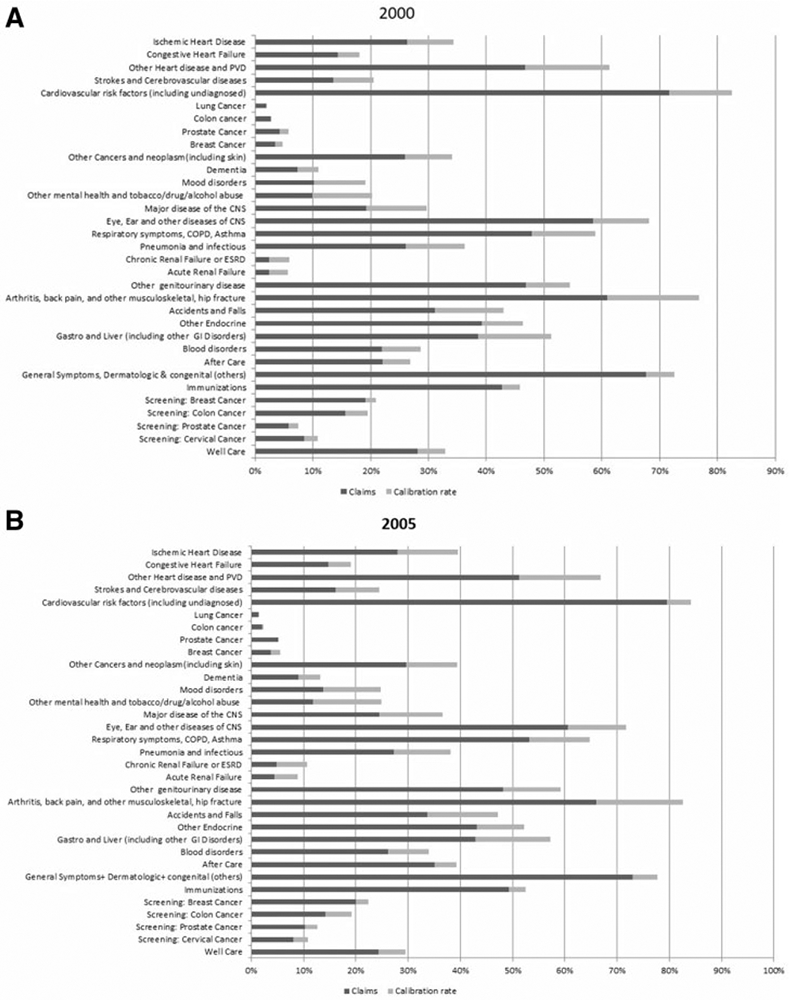
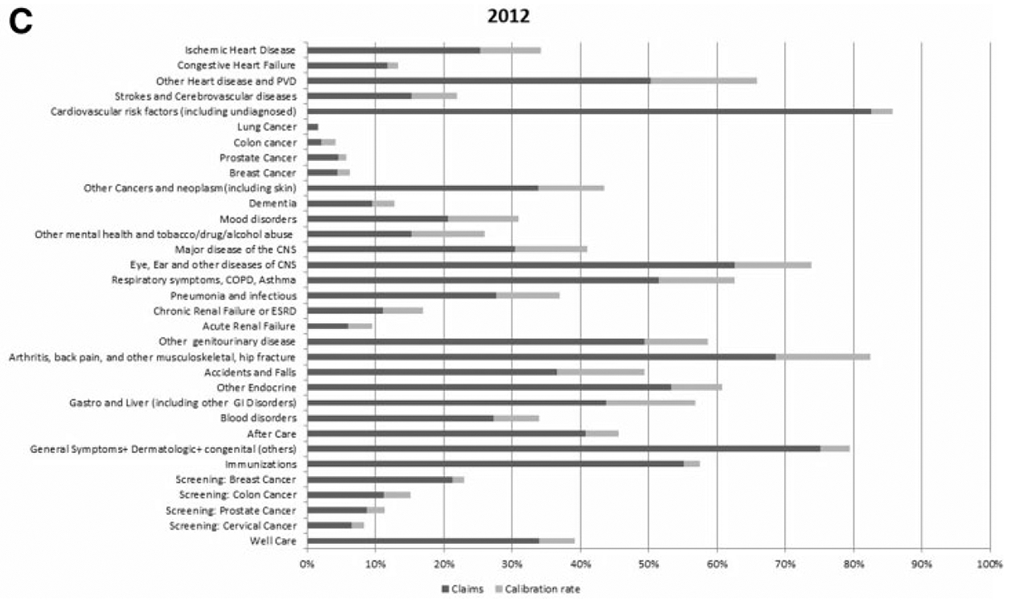
Figure 4.


Bar Graph Comparing the Calibrated Claim and Claims-Based Prevalence Rate Estimates of the 32 Health Condition Categories for Years 2000, 2005, and 2012. (a) Year 2000. (b) Year 2005. (c) Year 2012.


Bar Graph Comparing the Calibrated Claim and Claims-Based Prevalence Rate Estimates of the 32 Health Condition Categories for Years 2000, 2005, and 2012. (a) Year 2000. (b) Year 2005. (c) Year 2012.