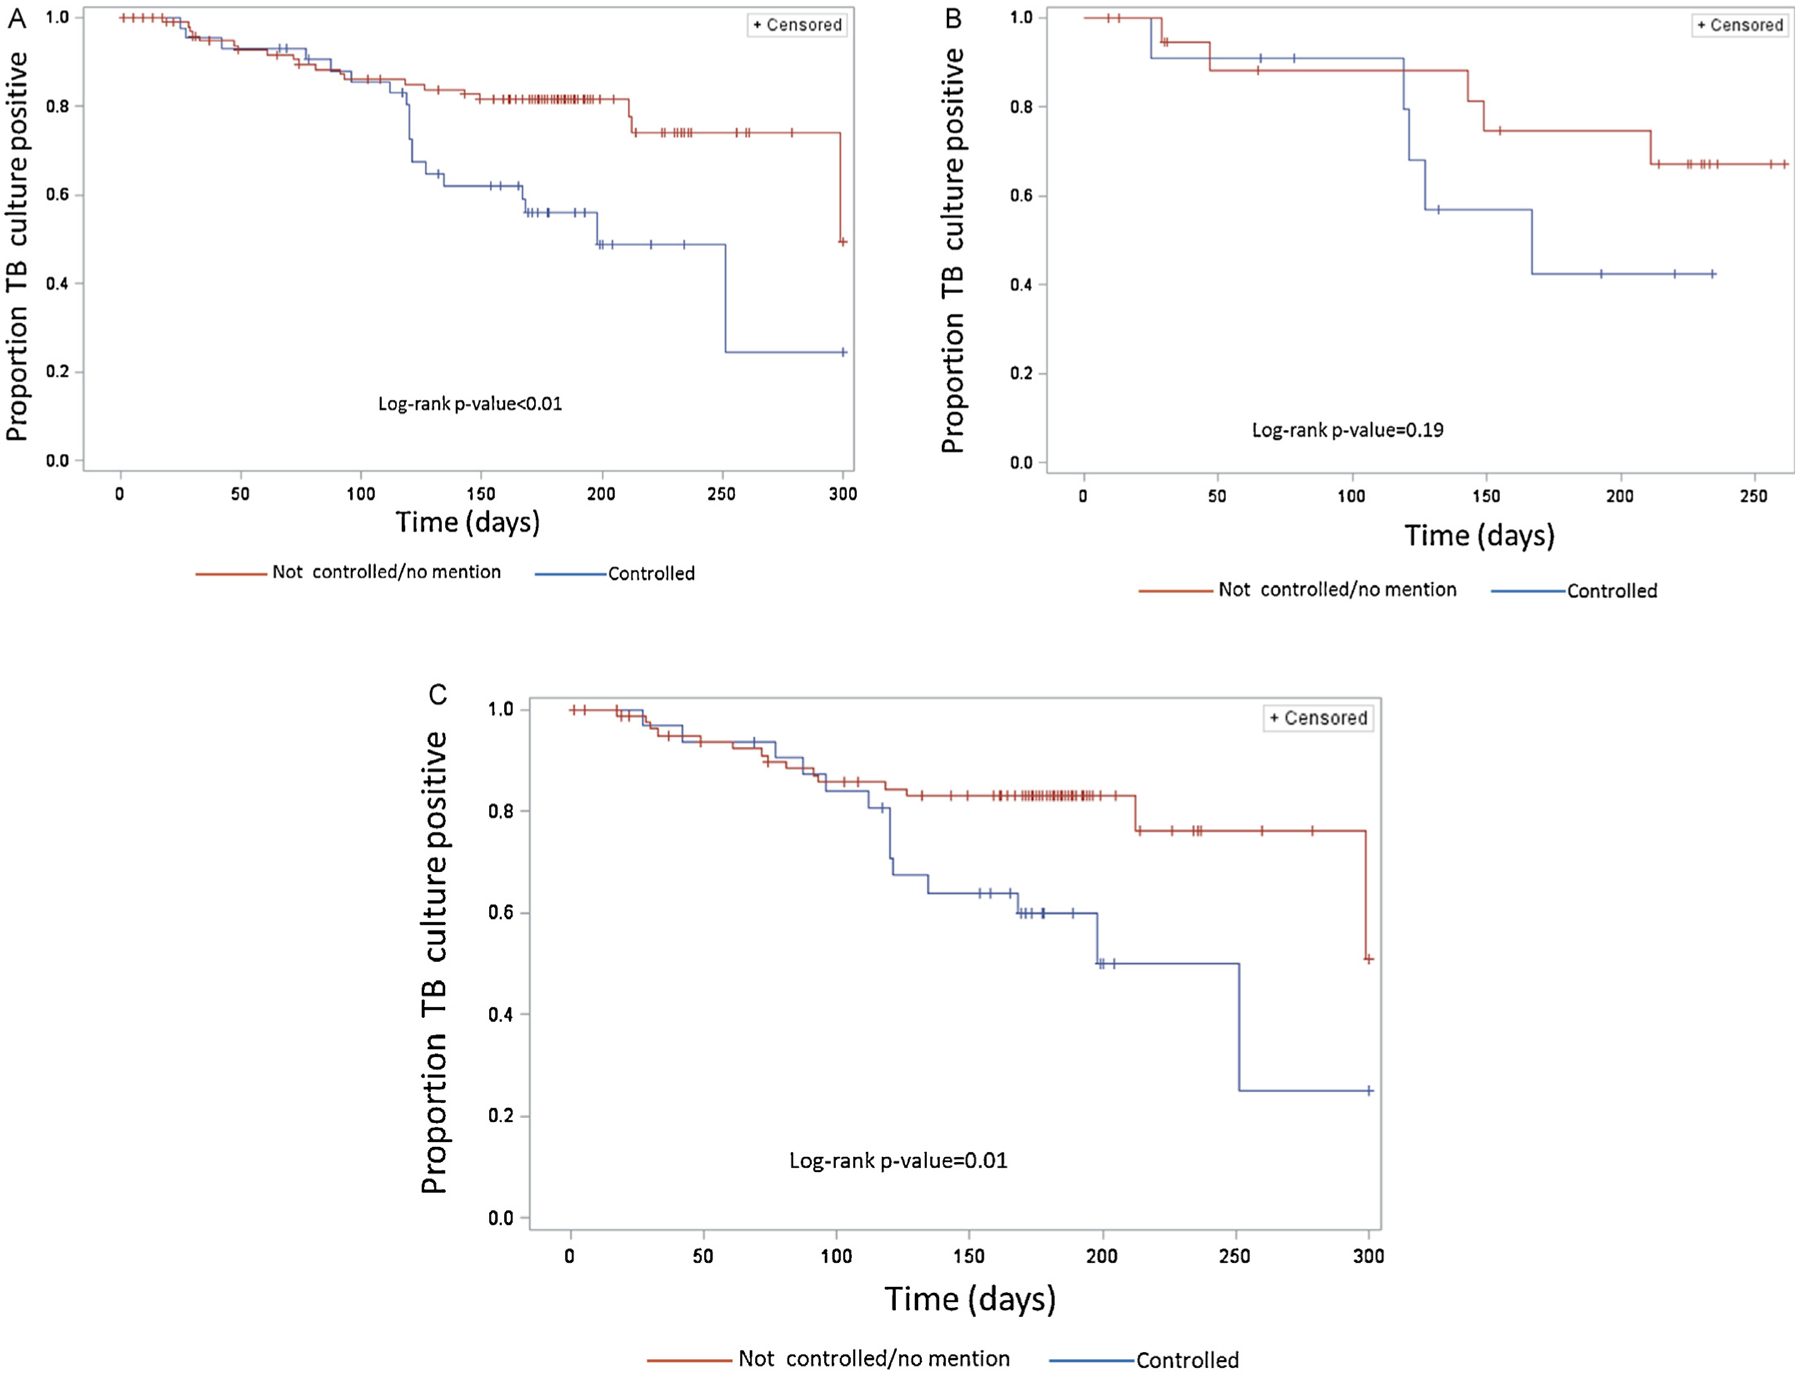
Figure 3.

(A) Kaplan–Meier curves for time until tuberculosis (TB) culture conversion from positive to negative by diabetes control status among TB patients with diabetes mellitus (n = 149); control status determined by medical record indication. (B) Kaplan–Meier curves for time until TB culture conversion from positive to negative by diabetes control status among TB patients with diabetes mellitus who have been previously treated for TB (n = 32). (C) Kaplan–Meier curves for time until TB culture conversion from positive to negative by diabetes control status among patients with diabetes mellitus who have not been previously treated for TB (n = 117).
